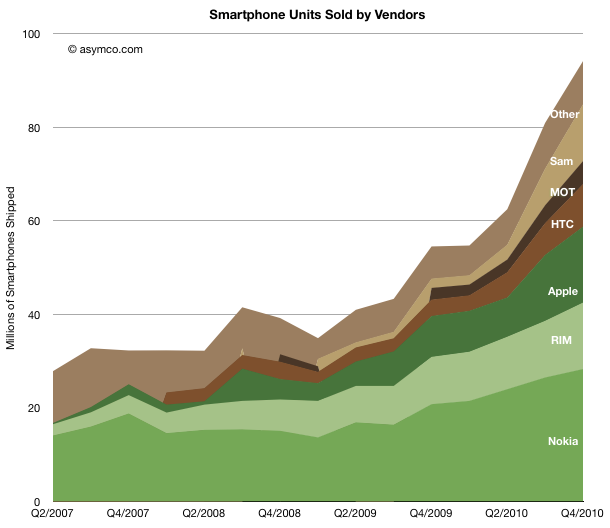
The smartphone market grew to about 100 million units last quarter. That’s nearly double what it was a year earlier and triple what it was three years earlier, the year the iPhone made its debut.
Few markets grow this quickly, especially as this tripling happened during one of the worst recessions for a century. 100 million units a quarter is not a small number. The rate at which smartphones are growing makes clear the trajectory of where all phones are going.
As I’ve shown in profitability charts, vendors have been benefiting to differing degrees. The overall smartphone market with individual vendors is shown below:
I’ve used the color coding of shades of green for vendors which use their own operating systems and shades of brown for vendors which use a licensed operating system (licensees).
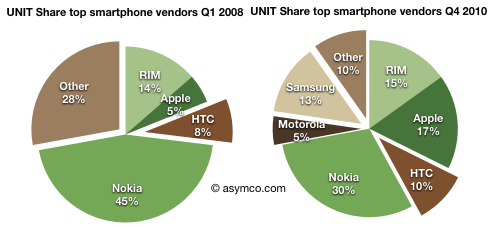
What remains interesting is how the share of licensed OS products has changed since 2007. I selected two snapshots in time: Q1 2008 and Q4 2010 and compared the shares that licensees were able to obtain.
The shares of licensees was then 36%, and is now 38%. Not a huge increase, but an increase nevertheless. In the last such analysis in Q3, the share of these vendors (which I also call “Modular”) was actually lower than in early 2008.
RIM has held steady in terms of share. HTC has added a few points of share. Apple seems to have gained a healthy share which Nokia seems to have lost. Samsung and Motorola have certainly made a bigger mark in the last few quarters.
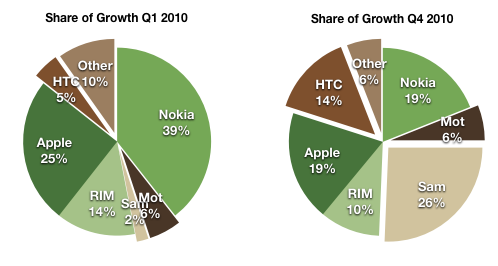
But I would caution that share comparisons when the market is growing at nearly 100% are not very meaningful. All vendors are increasing their sales, though a different rates. What would be more meaningful would be a “share of growth” measure where each vendor’s increase in units is divided by the overall market’s increase.
That analysis gives us the following chart. (I added Q1 2010 for comparison).
Samsung did very well, but surprisingly perhaps, so did Nokia, tying Apple for second place.
The licensees (whose pie slices have been exploded) added up to 52% of total growth (y/y) and the integrated vendors had 48%. A pretty even split.
Discover more from Asymco
Subscribe to get the latest posts sent to your email.


