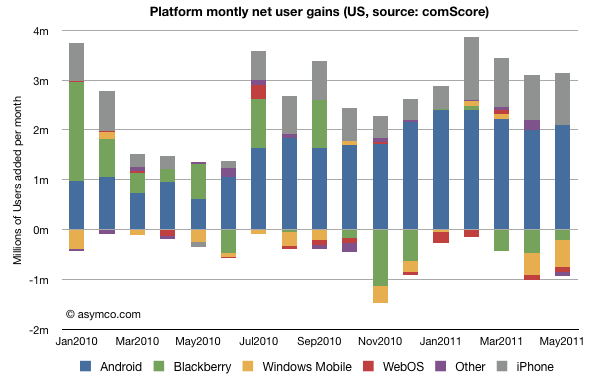
The following chart shows the net gains in users for the major mobile platforms in the US. The data is derived from comScore’s MobiLens report.
The raw numbers for the last period (ending May) are:
- Android gained 2.1 million users
- iPhone gained 1.0 million users
- WebOS/PalmOS lost 96k users
- Blackberry lost 202k users
- “Other” lost about 95k users
The “churn” or percent of smartphone users who switched platforms is 1.22%/month of the overall users (assuming users to left one platform moved to another rather than to non-smart devices.)
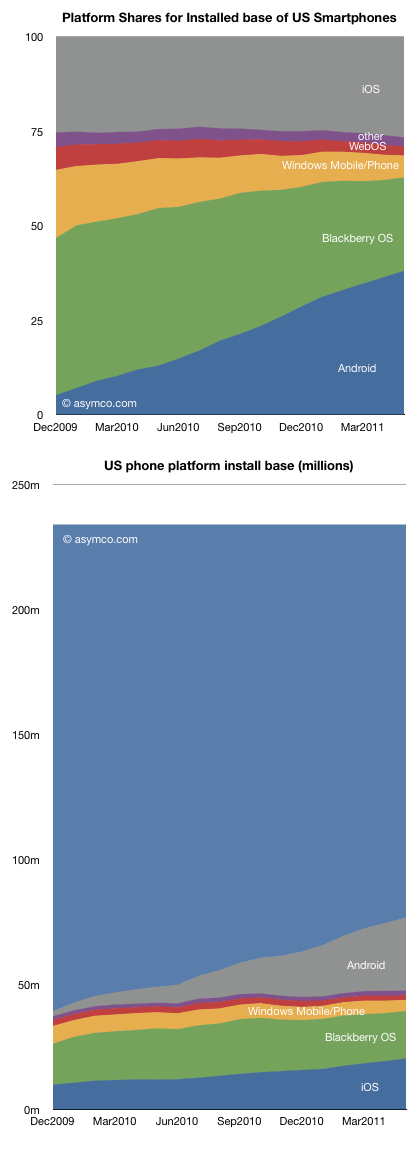
The share of the platforms and the overall composition of users is shown in the following two charts:
As usual, caution should be exercised when looking at share (top chart) outside the context of overall growth. The second chart may be more illustrative of what is happening. The light blue area on top is the smartphone non-consuming population.
Android has been a tremendous accelerant of smartphone adoption while iOS has grown as well but share has not grown significantly. iPhone growth has kept up with market growth. This cannot be said for the other platforms which have been “squeezed” between these two entrants.
So although the main competition is with non-consuming users and smartphones are winning in general, the loss of users by some of the incumbents is unsettling.
Microsoft lost just over 2 million users in the US last year while RIM lost a net of 1.5 million. Palm lost about half a million. Contrast this with 8.5 million iPhone additions and 23 million new Android users.
In particular, Windows Mobile/Phone is down to 5.8 million users (down from 18m in December 2009). With a loss of half a million per month, and share down to 4.5%, a lot is riding on the new platform.
I’ve argued that the post-PC era will be a multi-platform era. Although it may seem that the situation in the US is rapidly moving toward a duopoly, it may not end up that way. Note how much non-consumption still exists.
Note the time frame of the charts is only 18 months. The rapidity with which platforms gain ground could allow for continuing platform churn.
Discover more from Asymco
Subscribe to get the latest posts sent to your email.


