Almost all valuation models for Apple assume it’s a hardware company. The modeling algorithm for hardware is simple:
- For each year in near future
- For each product line
- Compute contribution
- Determine company value by summing contributions and multiplying by a P/E ratio
The major difficulty is in predicting the growth of each product line. This is difficult because buyers can be fickle. Companies employs all sorts of tools in order to secure repeat customers but if switching costs are low, the company can crash in value. For this reason, analysts pick various ways to predict device sales. Some choose to index each product on production (channel checks), demand (customer surveys,) or even on a top-down share of total (market research on growth of whole market and assumptions of share).
Although simple and convenient, this model does not probably match the way Apple is managed. The company does not build hardware products to sell and forget. It builds platforms which are best seen as sources of recurring revenues. Users are incentivized to continue buying devices. iCloud, iTunes and other Apple properties are expressly designed to that goal–and they are not cheap to run. So, the company must see the world through a different set of lenses than the default model shown above.
To think about the business like they do, we need to put the data through a similar set of lenses. I began with a modest proposal last month to value each user as a source of recurring revenue. Now it’s time to expand on this method.
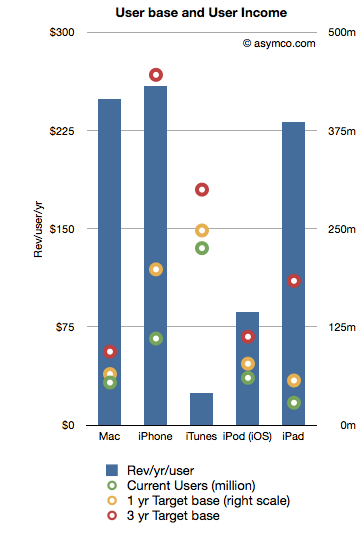
The following chart shows the recurring revenues per user by product and the current and possible future size of user bases.[2]
Revenues/yr/user are bars with the left axis and the User bases are various colored circles indexed with the right axis.
The assumptions that went into the data are as follows:
- Device life span is as per previous article linked above
- User base growth for 1 year is: Mac 20%, iPhone 80%, iTunes 10%, iPod 30%, iPad 100%
- User base growth for 2nd and 3rd years (recurring): Mac 20%, iPhone 50%, iTunes 10%, iPod 20%, iPad 80%.
- The Revenue per user is assumed constant
Note that the user base growth figures are lower than the product growth levels seen historically. Obviously, the model is highly sensitive to these growth assumptions so they need to be scrutinized and tested rigorously.
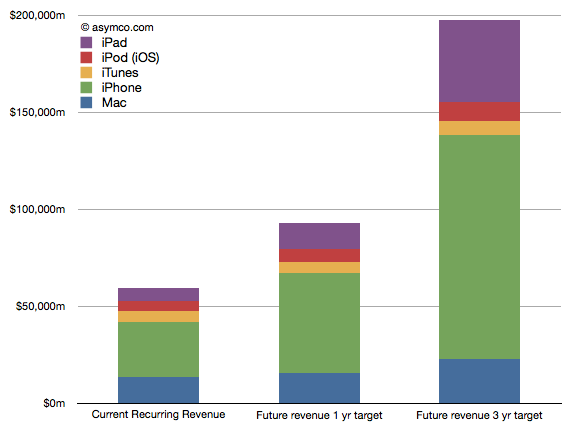
Nevertheless, as a straw-man proposal, the recurring revenues for all these products[1] is shown in the following chart:
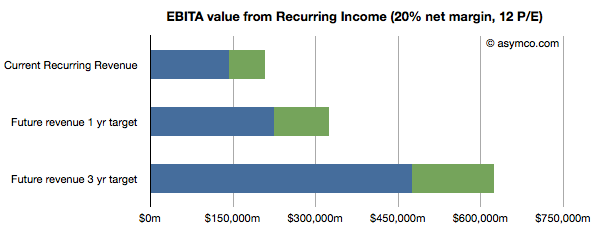
Once the income is estimated, we can take that value and assume a profit margin (net) and then multiply the earnings by a multiple. Using a 20% net margin and 12x P/E yields the following chart.
(I added an assumed level of cash in green.)
This model would imply that the company today could be valued at $208 billion on the basis of its installed base alone. That value would be about $323 billion in one year and $620 billion in three years. Dividing by the number of shares outstanding (935m this year increasing at 2% a year) yields a share price of $222, $339 and $629 by mid 2014.
These values can be considered “lower bounds” on valuation since they assume income from previously secured customers. The speculative part of investment would be based on what the future bases will look like (so, for example, if one believes these assumptions, the $629 figure could be considered a target to be discounted to today).
—
Notes:
- Excludes Software, Peripherals, non-iOS devices, and any other service revenue.
- Compare this char to social media companies (MIT Technology Review)
Discover more from Asymco
Subscribe to get the latest posts sent to your email.


