In the last two posts (How much does an Apple store cost?, The down payment on iCloud) I discussed two line items in the PP&E asset class on Apple’s Balance Sheet. In isolation, the data is interesting as it gives us an idea of the cost structure of stores and facilities being developed to sustain its current business model. In aggregate, it provides insight into Apple’s strategic intent.
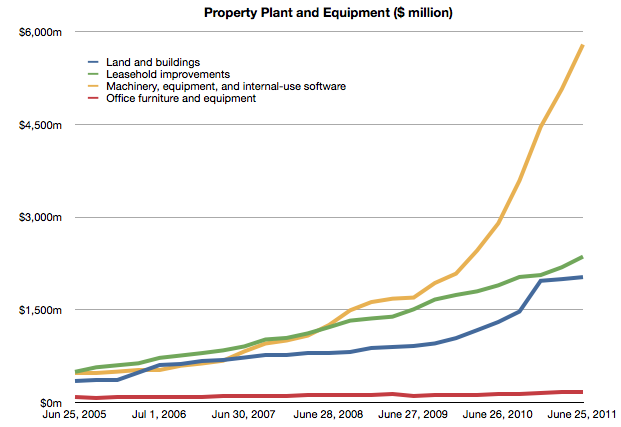
To complete the picture, I will look at the third asset: “Machinery, equipment and internal use software.” It’s the yellow line in the chart below:
It’s plain to see at first glance that it’s the most significant asset. What does it represent and what conclusions can we draw about Apple’s strategy?
Before I begin, I should make clear what this asset represents and what it does not represent. These expenditures cover equipment used in production. They do not include components used in the production nor loans to suppliers for purchasing equipment. These are fixed assets that can be depreciated on a schedule and have specific tax treatment as a result. These are, in plain language, instruments used for producing things to be sold. They are things Apple owns.[1]
Using the same method as in the other asset analyses I took a measure of the sequential change in that asset over the time period and tried to see if there is a correlation between that spending and some other measure of output from the company.
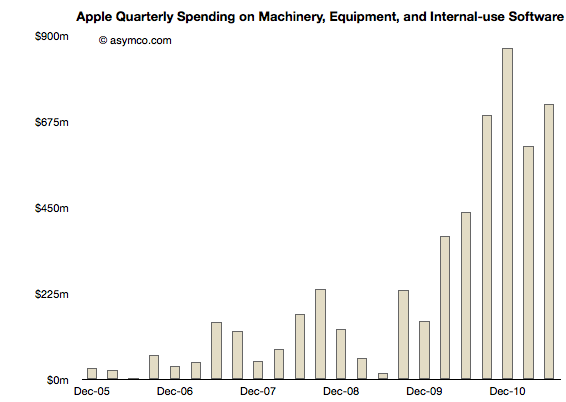
Here is the sequential change chart since the end of 2005:
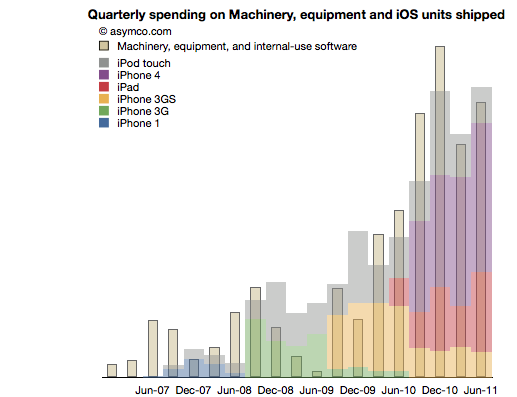
I noted that the pattern seems to relate closely with the increase in shipments of iPhones. More specifically, iOS devices. To test this I overlaid the overall volumes (with estimates of product types) of iOS shipments. This is a modified version of the chart published here.
There is a broad similarity. But again, as in the other analyses, the spending on assets typically predates the “output” from that asset. As we saw in land and buildings, the operational start of a facility may happen many quarters after the purchase is made. Similarly, stores open some time after the spending on fitting them out.
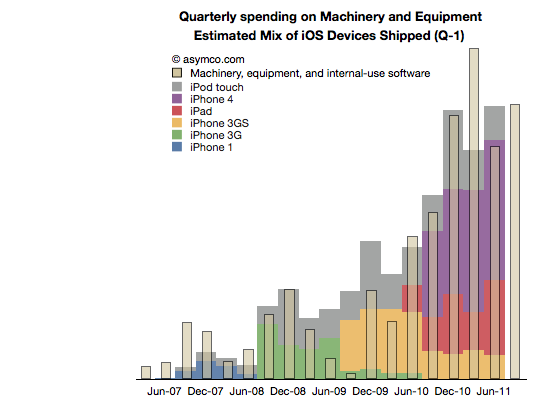
So it is with Machinery and Equipment. If we time-shift the output one quarter to account for spending before production we have a better fit (note the change in the title with “Q-1” indicating that the dates for the iOS shipments are offset by 1 quarter to the left).
We can even take the analysis further by breaking the spending and output into Phases corresponding to specific product cycles and introductions.
Phase 1: The original iPhone
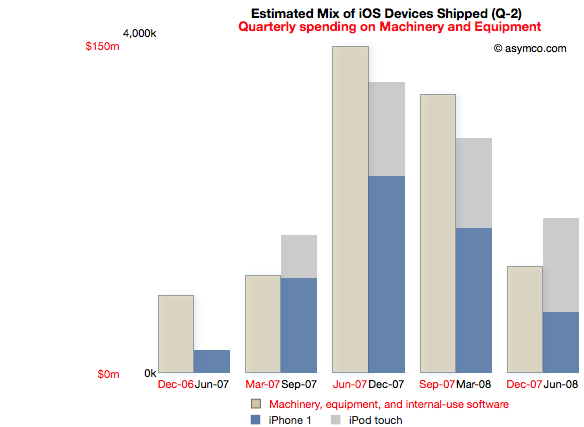
Spending on M&E prior to the iPhone launch began two quarters in advance of sales. The following chart reflects this delay. Note that the M&E payments are marked with quarters ending six months earlier than the shipment schedule. Note also the scale (red denoting the M&E spending and black the units shipped). I also separated the two product types (iPod touch are my estimates, iPhone numbers are published by Apple).
This Phase corresponds to the first “bump” in the expenditure chart but offers more detail. There is an evident relationship between the “input” expense and the “output” of units shipped.
The cost of Phase I was $408 million.
Phase II: The iPhone 3G series
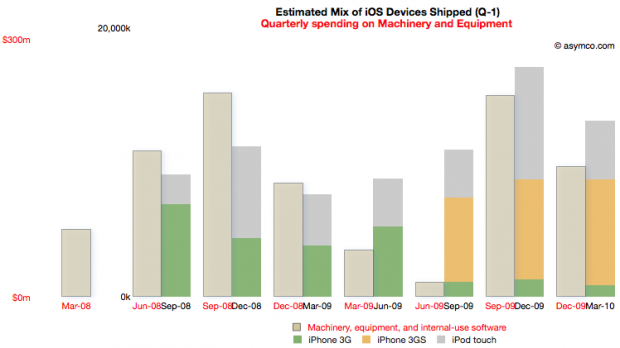
Phase II covers spending from the quarter ending March ’08 to December ’09 and production from September ’08 to March ’10.
For this Phase the time shift is only one quarter but there is a quarter’s worth of spending that is initiated prior to any shipments. I chose to demarcate this Phase to cover production for both the 3G and 3GS as they probably shared a lot of common equipment. Some spending on new production lines however still had to happen as volumes increased during 3GS production.
Note the scale change from the first Phase. Whereas the maximum in Phase I spending was around $150 million per quarter, the peak is nearly twice as much in the second Phase. The peak output is 5x higher.
The cost of Phase II was $1 billion.
[I had to guess whether the Sep 09 and Dec 09 M&E spending was for 3GS or whether it was to prepare for the ramps in the new products about to be launched in the third Phase.]
Phase III: The iPhone 4 and the iPad
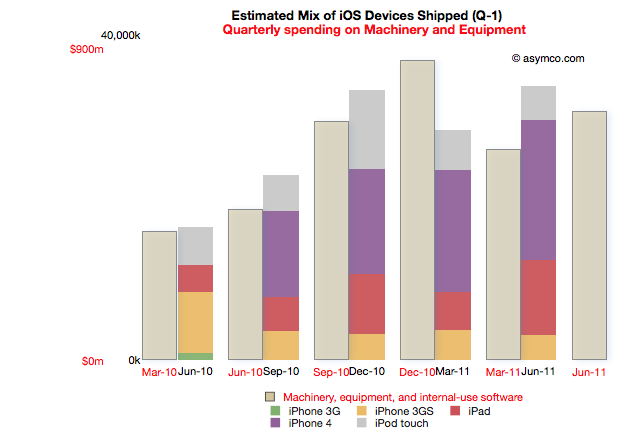
Phase III begins with spending prior to the launch of the iPad 1 (March ’10) to the last quarter (ending June 2011). Coupled to this is production starting in quarter ending June ’10 and ending in the last quarter.
Note that due to the time offsetting on production, the output from the spending on the quarter just ended will not be known until Apple publishes their shipments for the June quarter (scheduled for October 18th).
The relationship between pre-dated spending and production one quarter later holds quite well. There is a “surplus” of spending in December 2010 but that could be seen as the ramp being prepared for the second iPad.
Phase III cost is $3.7 billion so far.
Note again the change in scale from the previous two Phases. Peak M&E expenditures are around $900 million per quarter while production peaks at around 35 million units. This is a tripling of spending coupled to about a doubling of output.
Observations
The data suggests spending on equipment is correlated with the volume of production of its iOS devices. However, Apple is understood to be a company that outsources its production and does not “own” its own factories. Claiming that it keeps equipment used in the production of iOS devices on its books is an extraordinary claim.
I make a further claim that the scope of spending itself is extraordinary.
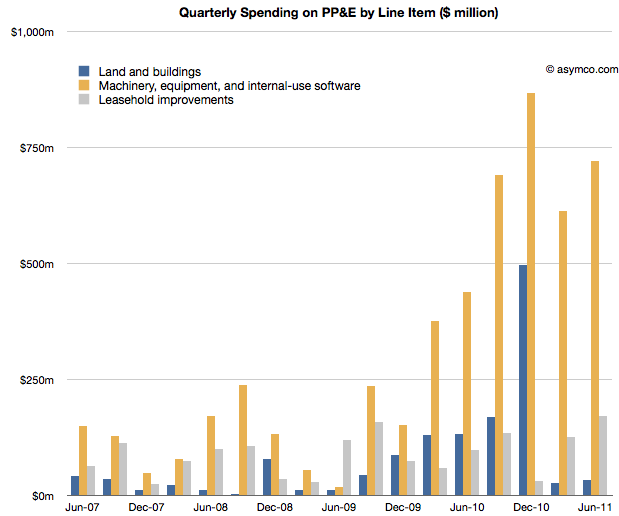
The following chart shows the three asset classes discussed in the three latest posts relative to each other (quarterly change in asset value).
In How much does an Apple store cost? I noted that the spending on leasehold improvements of $2 billion over a few years is significant and sustaining and largely asymmetric to competitors. You can see that spending in the grey bars above.
In The down payment on iCloud I noted that spending on Land and Buildings is significant and sustaining to iOS but not on a scale many can match. Those costs are shown in the blue bars above.
If, as I claim here, the yellow bars show the spending on Machinery and Equipment used in the production of iOS devices, then the commitment Apple has made to controlling production is even higher. In December 2010, M&E expenses were 50% higher than the spending on the data center and the new Cupertino campus put together.
The M&E assets have cost a total of $6 billion. The Apple stores have cost $2.3 billion and land and buildings $2 billion. In other words, Apple’s machinery and equipment is worth much more than all its buildings and stores put together.
Compared with what Apple spends on other fixed assets, M&E is spectacularly significant.
In the twelve months ended June, Apple will have spent $2.9 billion in M&E to manufacture 118 million iOS devices. To put that in perspective, Nokia, which manufacturers a large (if not majority) of the 340 million phones it sells, expects full year 2011 capital expenditures of $1.1 billion.
Correcting for amortization and depreciation and deducting some spending on Mac M&E, it’s very likely that Apple spent twice as much as Nokia on the instruments of production for one third the number of devices.
Conclusions
It may be too early to draw conclusions from this analysis. The claims should be debated and the claims should be tested, but I can suggest some tentative strategic implications.
Last December I wrote that I thought Apple should use its capital to own the means of production for iOS. I reasoned that device supply was its biggest deficiency and that perhaps ownership would allow them to become better at it.
Indeed, Apple has used capital to ensure it has better control over the supply of components and to also perhaps ensure capacity of production of those components.
But this analysis shows that Apple has gone much further toward integrating its value chain. It suggests that a large part of the tooling in its supply chain is owned by Apple. It suggests that those tools are put out of reach of its competitors.
The implications could be profound but given the length of this post, I’ll leave that discussion for another day.
—
Notes:
- Some of the capital expenditures were also allocated to servers or “information systems hardware, software and enhancements.” From the Annual Report 2010:
Capital Assets. The Company anticipates utilizing approximately $4.0 billion for capital expenditures during 2011, including approximately $600 million for retail store facilities and approximately $3.4 billion for product tooling and manufacturing process equipment, and corporate facilities and infrastructure, including information systems hardware, software and enhancements.
Discover more from Asymco
Subscribe to get the latest posts sent to your email.

