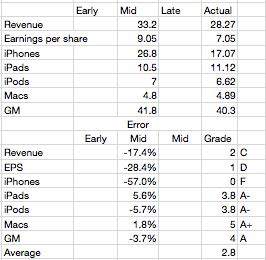
Last quarter I was wrong because I thought Apple would throttle production of the iPhone 4 in the fourth quarter post-launch. “The reason growth would moderate was that Apple slowed production of the old model in order to switch out to the new model–we saw the same thing happen with the slowdown in iPad 1 and transition to iPad 2.”
 As a result I seriously under-estimated iPhone volumes in the second quarter (FQ3). That failure led me to question whether the theory I was using in forecasting was still valid. When it came time for a new estimate I hesitated.
I had to choose whether to apply the old seasonality theory or to assume that the game had changed and that the product would now grow organically.
The first assumption would put the iPhone growth at 100%+ while the second would place it in the 60% to 80% range. I decided to dial in a figure somewhere in between at 90% but I’m not very confident in this
The result was an over-estimation by almost the same error as that of the previous quarter. Most of the other product lines were accurately predicted, but again, as a always, the whole forecast rides on the iPhone.
So where does that leave the theory?
I now believe that the iPhone behaves far more consistent with the original theory. Namely that…
- Overall production capacity is increasing at approximately 100%/yr.
- There is significant seasonality due to production ramps as the product is updated on a yearly cycle. These cycles are tuned to reach maximum throughput during the US holiday period. I discussed this theory here.
- Demand is practically unlimited and is throttled by both production schedule and distribution agreements
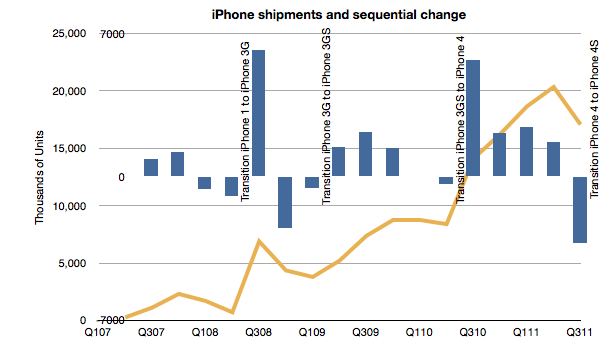
The first point is not controversial. The iPhone continues to grow at triple digits rates. The second quarter’s 142% growth and the first quarter’s 113% growth more than makes up for the 21% of the third. Fourth quarter promises to be exceptionally strong with management clearly guiding for a blockbuster.
The point of contention was number 2. If we look at the following chart, we can observe that it still holds:
Each new iPhone launch was preceded by a quarter where units went down sequentially. The same has happened with the iPad for the one tradition we’ve had so far.
Regarding the third point, Balance sheet analysis shows that investment in manufacturing process equipment installation slowed in the March quarter. That was not matched by a decline in the June quarter sell-out however it does correspond with a slowing in the September quarter. Using the PP&E line is something I’m still exploring but it does seem that there is support for the theory.
Mea Culpa
I made an error in abandoning my theory. I thought I had discovered an anomaly that made it invalid. I was wrong. I read too much into the late in cycle boom. I bought into the notion that the product was in a new pattern of behavior–due to expanded channel or broader portfolio. This was a mistake.
Footnote
- There was one other bit of data that was offered to us which we ignored. At the 4S launch Tim Cook gave us a warning. He announced that 250 million iOS units had “just been shipped”. After the announcement it turns out that the total was around 254 million. This came up in comments on this blog. I noted that if the number is correct I should shave 13 million off my iPhone number. I even went into my model and adjusted it to see the effect. I did not “correct” my estimate as I felt that this new data could be disguised and not meant to signal to us. This was another error.
Discover more from Asymco
Subscribe to get the latest posts sent to your email.

