Prior to the third quarter earnings report I discussed a part of Apple’s balance sheet related to tangible assets (Plant, Property and Equipment). In a series of three posts I covered the Land and Buildings (data centers and campuses), Leasehold Improvements (store investments) and Machinery, equipment (tooling and factory equipment as well as servers.)
The data shows that there is a consistent pattern of investment in pursuit of strategic goals: extending reach into distribution through stores, extending services through cloud infrastructure spending, and extending control over the supply chain. One story that still remains largely untold is how much does Apple know in advance what it will spend.
In other words, can we tell if Apple can anticipate demand and does it plan its expansion well in advance?
For an answer, the 10 K report comes in handy. Published only once a year, this document shows some data that is not present in any other public release. For example, Apple makes forecasts for capital spending.
But first, an update.
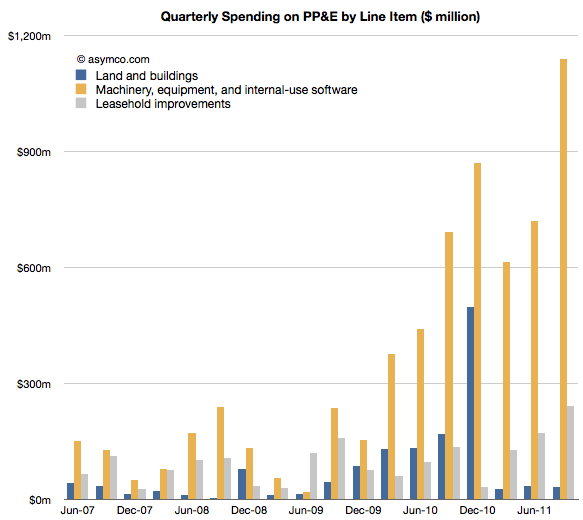
Since the last discussion on PP&E, Apple reported third calendar quarter data. The 10K offers the details on how much was spent in the last quarter. Leasehold improvements increased by 240 million, a new record high. That might have gone into the 30 new stores opened in the quarter but it also signals more openings and renovations still to come.
Land and buildings did not see any significant increase ($31 million).
Machinery and Equipment growth was explosive. Over $1.1 billion was added to the value of those assets. The previous high was $868 million in Q1, presumably getting iPad and iPhone production ramped. The total for Q3 is about half of what was spent in all of 2010. The chart below shows the three items:
The increase in M&E foreshadows increased device production so, while not very precise, it gives an idea that volumes are expected to be substantially higher in the following quarter. More about this when I make my forecast.
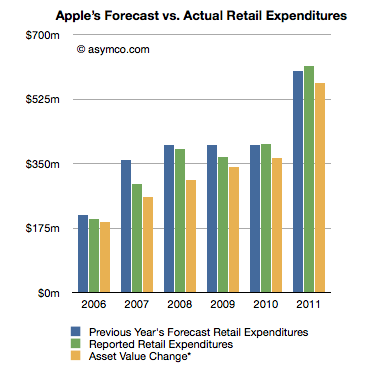
Now I want to focus on Apple’s ability to forecast its own production. As I mentioned, once a year, Apple predicts its CapEx. That prediction is broken down further by Retail expenditures and M&E+Real Estate. Let’s look at Retail first.
The following chart shows three bars: a previous year’s forecast (from the 10K), reported expenditure (from the next 10K) and my own running estimate based on asset value changes.
If we consider the forecast as a “budget” for the next year, what can be observed is that the spending was closely “within budget”.
Going by reported expenditure, the company was within 1% of expected budged for store spending in 2010 and 2% in 2011. It underspent for the years 2006 through 2009, though again, but modest amounts.
What this suggests to me is that store roll-outs are predictable for Apple. The costs involved are also quite predictable and things seem to be happening on schedule. The retail expansion is a steady slog.
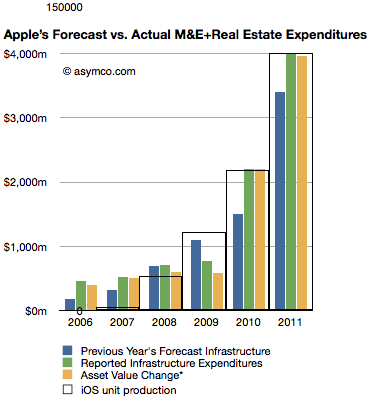
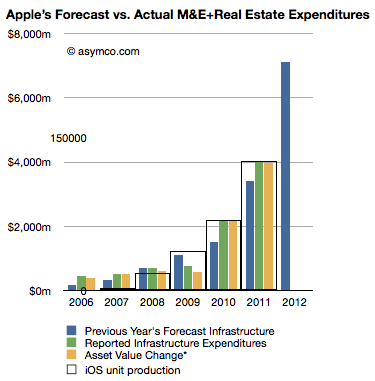
The next chart does the same comparison but with Machinery and Equipment and Real Estate.
 Here the story is different. The company has typically over-spent what it forecast.
Here are the “deficits” for this asset class by fiscal year:
- 2006: 154%
- 2007: 68%
- 2008: 0%
- 2009: -30% (surplus)
- 2010: 47%
- 2011: 18%
This suggests that unlike retail, production for Apple has been far less predictable and that the predictions for spending were mostly lower than actuals. It might imply that production was higher than expected as well.
What this analysis suggests overall is that although production (and spending) are increasing, the rate of increase is a bit higher than what Apple expects a year in advance. Some of that might be due to increased costs, but some may be due to changes in capacity.
Note the iOS unit production “wireframe” bar chart overlaid on the expenditure chart. As with quarterly data, the yearly (fiscal) production ramps remarkably consistently with M&E expansion.
 Looking forward, the company predicts $8 billion in PP&E, exactly twice what it forecast last year. Retail expansion is forecast at $900 million an increase of 50% and “Infrastructure” (M&E) increase of 110% to $7.1 billion.
Knowing that Apple tends to over-spend on M&E, we can assume that they will at least double spending on machinery and equipment. Knowing further that increase in M&E spending correlates to iOS device production (see chart at left noting the inset scale marked with 150 million units), it implies that iOS device production is set to continue growing at the same rate it always has: 100%.
Discover more from Asymco
Subscribe to get the latest posts sent to your email.


