Andy Zaky at Bullish Cross wrote a great post on Apple’s valuation, showing the deep discount of Apple’s earnings vs. an average company. It essentially states that Apple’s money is not green.
Felix Salmon took it forward by enumerating a few explanations that might be used for the despondent valuation. None are successful arguments, but that should not be a surprise.
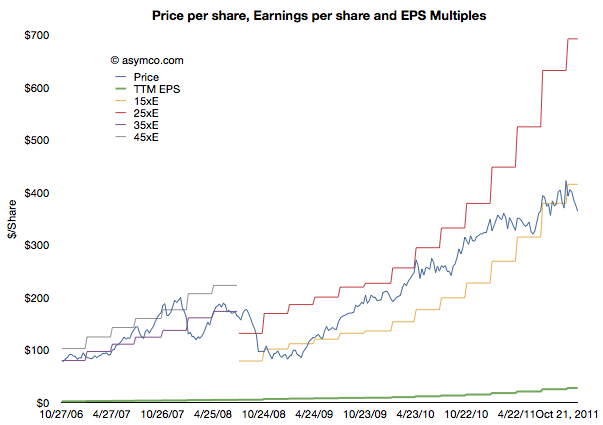
To understand the phenomenon a bit more precisely, I maintain and think about these charts:
This shows Apple’s share price (“P” in blue) and its earnings per share (“E” in green). In addition there are multiples of the earnings in “bands”. The first band is 35xE to 45xE which bounded the price during the period of 2006 through most of 2008. The second band is 15xE to 25xE which bounded the price since then. The data is updated weekly so it is current as of last Friday.
Illustrating it this way shows how the stock is seen as representing different companies at different times. The 2006 era (iPod) Apple was seen as a high growth, dynamic company with loads of headroom for growth. The current (iOS) Apple is seen as a slow growth, fairly static company with most forecasts showing 20% growth potential.
Note that the price has dropped outside the current band for the first time since the great recession. It is still below 15xE today. Perhaps a new band is forming.
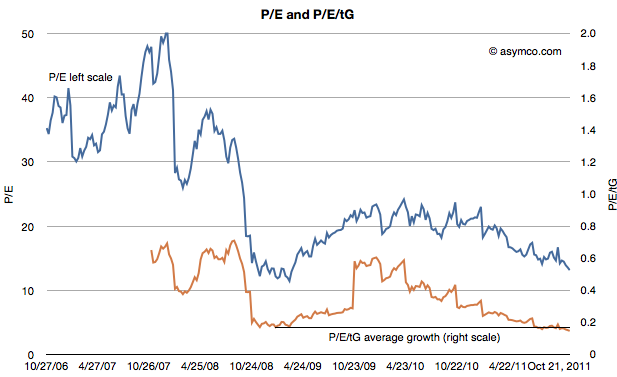
The second chart shows the P/E on its own (in blue) but with a second measure where the P/E is divided further by the average trailing twelve months’ growth (P/E/tG). This is a variation on the P/E/G (aka PEG ratio) where instead of (mostly wrongly) estimated future growth I use actual growth history–hence the t for trailing. The P/E/tG is a way to normalize P/E as a function of growth and hence a more appropriate index of value potential.
I added a horizontal line to the chart to show the minimum value P/E/tG reached during the recession (0.17 in January 2009). As you can see, the P/E/tG is now lower than at that time (0.15). It implies a deeper discount for the company’s earnings growth than during the time when the world faced economic contraction.[1]
Note also the trend of that line as it shows a steady linear path toward zero.
Of course, it cannot reach zero unless Apple files for bankruptcy. But until it does file, the line can only reach zero asymptotically as E/tG increases. Which is a relief, I suppose, as it means the rate at which P/E/tG drops will decrease. This implies that as earnings growth persists, the drop in price will have to moderate.
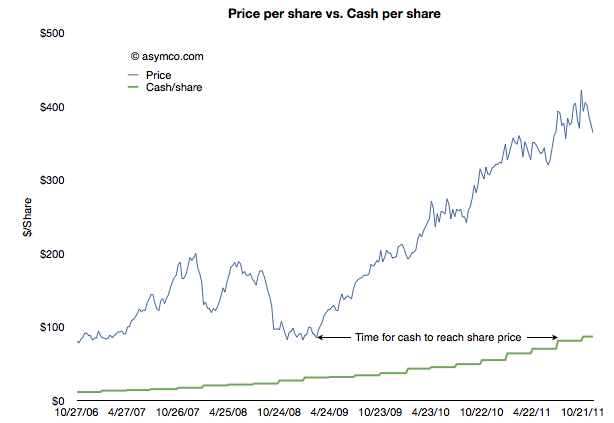
The other threshold to keep an eye out for is when Apple’s share price will reach its cash per share. That’s the point when investors will consider the company to be a net value destroyer. If you performed that analysis in January 2009, and you were accurate about earnings forecasting, the answer would be well before today. See the following chart:
In other words, in January 2009 the stock was trading at a price (<$80/share) below the current cash per share (>$85/share). It took Apple 18 months to grow its cash to reflect the price set on the company. Had the stock not risen then the company would today be trading below book value.
The amazing thing is that today the valuation structure (P/E/tG) is even worse than in it was January 2009. An interesting exercise would be to project how long it would take for the cash to increase to the current share price.[2]
I imagine this time interval should have a name. How about the time to boil: the time for growth pressure to become sufficiently high to exceed disbelief that growth can happen.
—
Notes:
- Note that the low values were placed on the company after the crisis took hold, not as an anticipation of contraction. See the behavior of the index during the summer of 2008 as the credit crisis was unfolding.
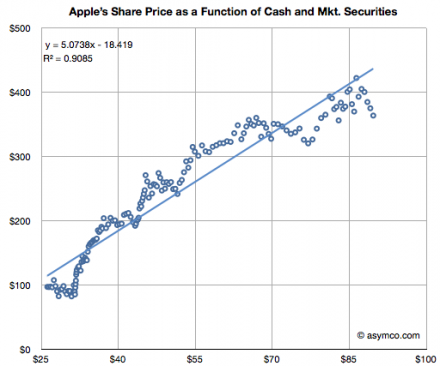
- This analysis is consistent with the analysis that Apple is not valued on earnings or earnings growth but on its balance sheet. The ratio of Price/Cash has been fairly constant but if it breaks down (as it has been–see below) then we need to assume a new dynamic is in place.

Discover more from Asymco
Subscribe to get the latest posts sent to your email.


