The latest data from comScore MobiLens is showing an uncharacteristic slowing in smartphone growth. In the survey period ending November, the number of smartphone users in the US was 91.4 million. This is equivalent to 39.1% penetration, an increase of 0.6% (i.e. up from 38.5% in the last period.)
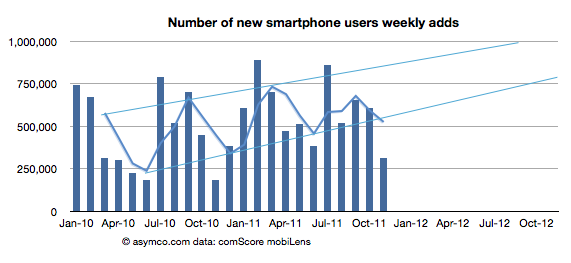
The growth is equivalent to 1.4 million new smartphone users (i.e. users who switched from a non-smart device for the first time.) The problem is that this is half the growth of the previous period. The following chart shows the growth as the weekly add rate.
As you can see, the growth has fallen to a level not seen since 2010. The cause may be seasonal as last November was also a slow month. I added a three month moving average which shows that although there seems to be seasonality, the last period did not show the peak of previous periods.
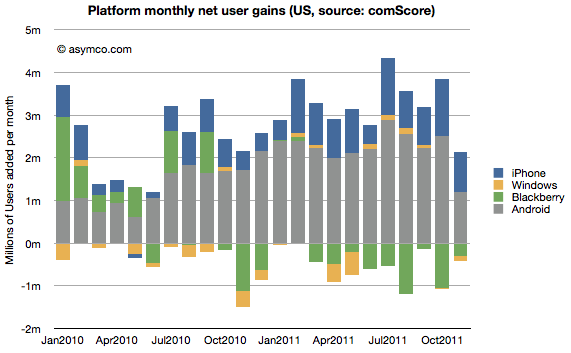
To better understand what happened, I looked at the performance by platform. The following chart shows the net user gains by platform.
What appears immediately is that Android growth was the primary cause of a change in the pattern. The iPhone grew slightly more slowly sequentially but the difference between November and previous periods is not great (941k adds vs. an average of 904k over the previous 12 months.) BlackBerry moderated its losses and Windows is quite a small influence on the market.
Android gain was 1.2 million vs a trailing twelve months’ average of 2.24 million. Android’s slowing in the US is significant.
We also have access to additional data from Google themselves. We had an update that showed that by late November there were 200 million Android devices activated. We also had an update from mid October of 190 million activations. That makes the increase in activations of at least 10 million during the same period that comScore was measuring the US.
comScore’s increase in Android users of 1.2 million then becomes even more interesting. It implies that the US consumers were responsible for no more than 12% of Android activations in the November time frame.
Furthermore we can derive from comScore’s data the total devices in use in the US by platform: the figure for Android is 42.9 million (46.9% of 91.4 million smartphones in use). By the end of November, the total activations from Android adds up to about 204 million. Excluding some devices which may be out of use, we can estimate that about 20% of all active Android phones are in use in the US. Conversely 80% of Android devices are in use outside the US.
This means that the US share of Android activations is decreasing. From a cumulative average of 20% to a recent 12%.
So the mystery of what caused the slowing in Android (and hence in all smartphones) in the US remains. Seasonal effects would affect all platforms equally and that is not the case. I’m not comfortable ascribing a cause until we hear more evidence and the pattern is more established. But something does seem to be happening.
[Update: The source data is available here. Note: multiple tabs.]
Discover more from Asymco
Subscribe to get the latest posts sent to your email.


