I analyze my performance every quarter to see if there is any pattern of error in my analysis. I devised a scoring method analogous to the grade point average system used in most US schools. You can read about the fourth quarter here.
This quarter I made one public release of data here and a semi-public update on the iPhone shipments here.
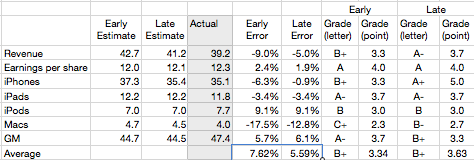
The resulting scores for both early and late estimates are shown in the table below:
Overall performance improved with the later estimates but not enough to move the letter grade. In fact, the letter grade of B+ is the same as it was for the fourth quarter.
The best performance was in (late) iPhone prediction and the worst performance was in Mac prediction. The Mac error was due to the relatively strong quarter the year before (which grew over 30%) and the lack of new product introductions. I did not think enough about these two conditions.
iPod error was in the direction of underestimation. The iPod grew better than expected through the average price seems to have dropped.
iPad error was quite modest at 3.4%. We found out after earnings that Apple was supply constrained. They indicated that they will sort out the supply/demand balance in the current quarter.
Gross margin also came in well above estimates, reaching a record high. This is difficult to predict as many factors come into play.
Overall the average error was less than 6% across all categories (late error). This means there was little wrong with the process of prediction. The seasonally adjusted growth for the iPhone and iPad remained consistent. Next, I will look at the scores for all the other public forecasts.
Discover more from Asymco
Subscribe to get the latest posts sent to your email.

