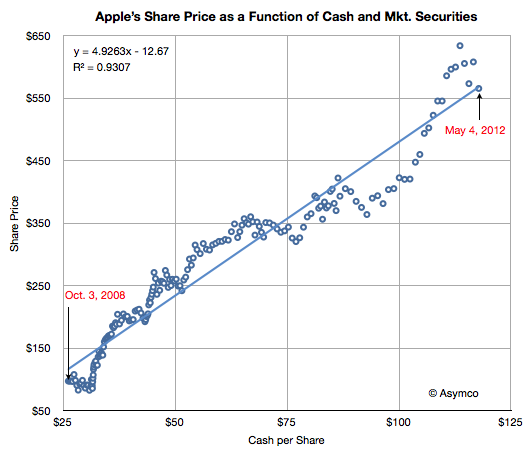
I first noted a correlation between Apple’s share price and its balance sheet a year ago. In February, when I last checked, Apple’s share price was priced nearly at 4.6 times its cash value. The stock has had a brief rally but has returned to the trend line it’s had since late 2008.
I should emphasize that this correlation between cash and price is abnormal. It should not be happening. Share prices for growing companies should be tracking its future potential, not its assets. I’m only presenting this data to highlight this abnormality. There is no fundamental basis for this happening. In fact, there is a basis for this not happening.
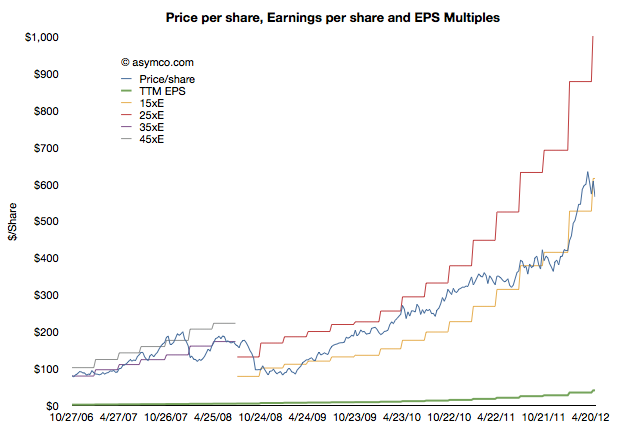
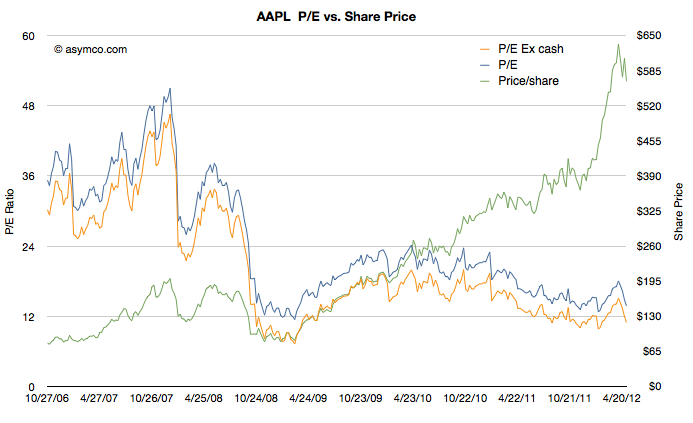
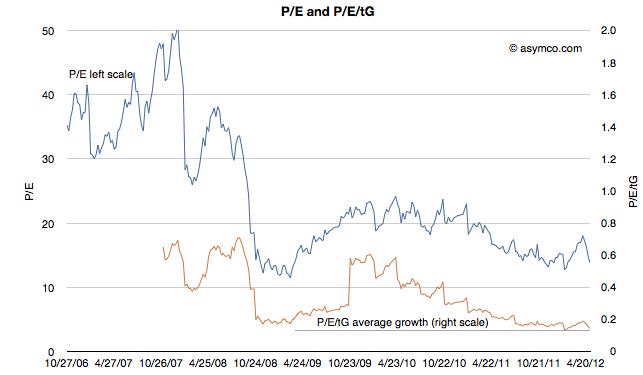
The relationship above is a symptom of another pattern called multiple compression that can be seen in the following charts:
The last chart in particular shows how as a function of earnings and growth, Apple is priced near a low. Certainly lower than during the depths of the 2009 recession.
Given this disconnect from the income statement, the pricing by balance sheet multiple seems to be a symptom of something deeper. Reasons vary with the seasons, but the company is not perceived to have sustainable growth.
Discover more from Asymco
Subscribe to get the latest posts sent to your email.


