IBM’s Digital Analytics Benchmark reported US Black Friday sales and the news is reasonably good. Overall online sales grew by 17.4% while mobile grew to make up 24% of traffic.
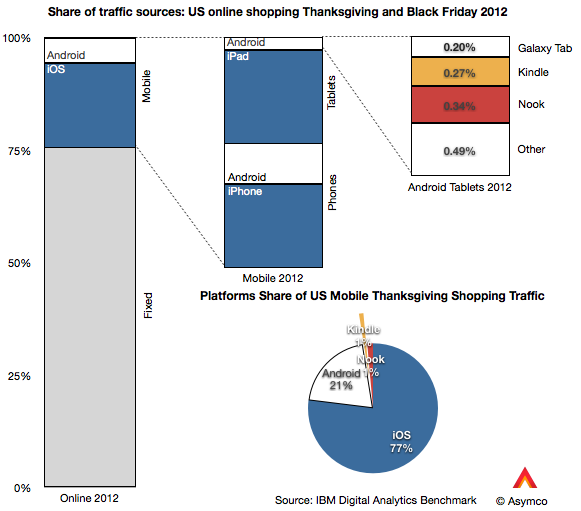
The data goes further to show the split between device types. I illustrate this split with the following graphs:
Of the 24% of traffic made up by mobile devices, phones contributed 13% and tablets 11% (or 54% and 46% of mobile respectively). Of the phone traffic, iOS devices were about two thirds of traffic and Android one third. Of tablet traffic, iPad was 88%, Kindle and Nook were 5.5% Galaxy Tab was 1.8% and other tablets were 4.4%.
Overall, iOS was 77% generated mobile traffic and Android (excl. Kindle, Nook) was 23%.
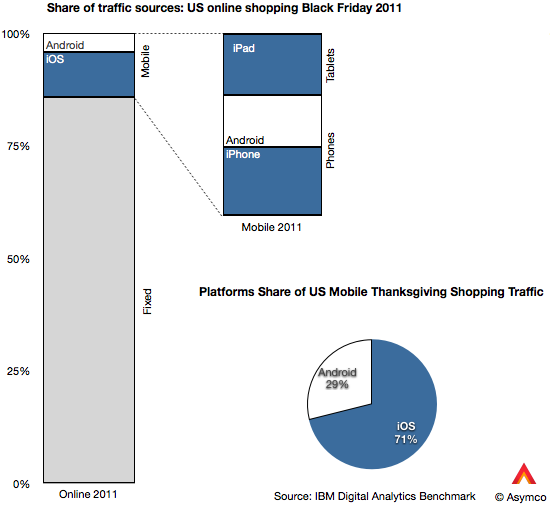
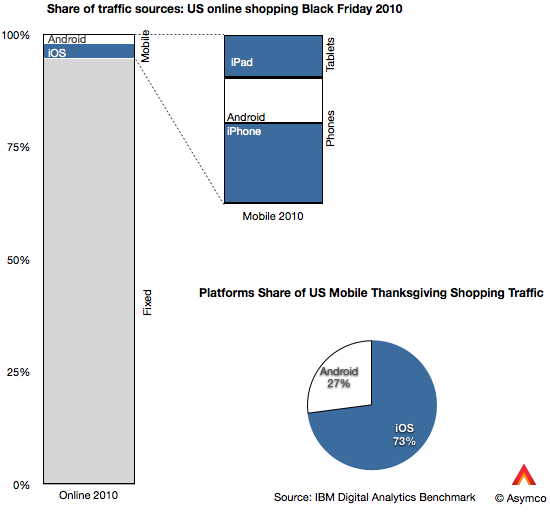
That’s an interesting snapshot of the consumption of mobile devices, but is there a pattern here? I also took a look at the same data from 2011 and 2010.
Besides the pattern of significant mobile growth (from 5.2% to 24% of online in two years) there is the curious effect of iOS growth outpacing Android growth. Android went from 1.43% of Black Friday shopping traffic in 2010 to 4.92% in 2012. In same time iOS went from 3.85% to 18.46%. In other words, while Android is up by a factor of 3.4, iOS is up by a factor of 4.8.
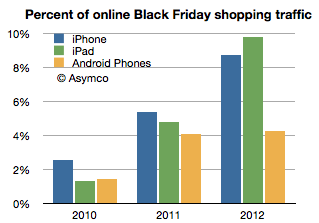
The reason is evident in the graphs above: the iPad is now the predominant mobile shopping device. You can observe the pattern in the following graph:
Two years ago the iPad was trailing Android usage but this year it was more than twice Android usage. Curiously, the iPhone seems to also be pulling ahead of Android.
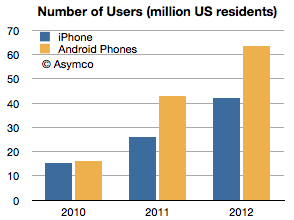
Curiously because the number of Android users in the US has gone the other way. That data is available from ComScore, though only for phones. (ComScore data for periods ending November each year, Nov 2012 is my estimate):
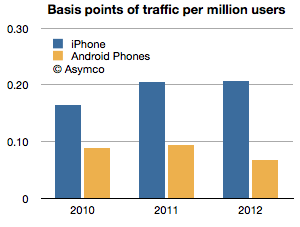
Having the number of users and the traffic allows us to measure consumption per capita, so to speak. That is, the percent of traffic per device user:
The ratio shown is basis points of usage (1/100 of 1% of shopping traffic) per million users of smartphones. iPhone users are about three times more engaged in shopping with their devices than Android users. Two years ago the ratio was two to one.
Overall iPad is changing shopping habits, but it has a near monopoly in its form factor at this point. The bigger question is what is causing phone users to behave differently based on the devices they own. The phone market is more mature and has had several years of competition to be able to discern differences in platforms. The pattern is pretty clear with respect to Android: engagement is down as ownership is up. This pattern has not exhibited itself with iPhone, even though it has had a longer time in market.
Of course, one would expect that later adopters would engage less, but I find it surprising that US Android users would behave so differently only two years after the platform began to be widely adopted. That pattern is not happening with iOS even after five years and certainly not with the iPad which is about as old as most Android brands.
This I consider to be a paradox: Why is Android attracting late adopters (or at least late adopter behavior) when the market is still emergent? We’ve become accustomed to thinking that platforms that look similar are used in a similar fashion. But this is clearly not the case. The shopping data is only one proxy but there are others: developers and publishers have been reporting distinct differences in consumption on iOS vs. Android and, although anecdotal, the examples continue to pile up.
And engagement is not a frivolous platform attribute. It is highly causal to success because it correlates with all cash flows associated with ecosystem value creation. Especially when a platform like Android depends more on engagement than “monetizing hardware.”
I’m not satisfied with the explanation that Android users are demographically different because the Android user pool is now so vast and because the most popular devices are not exactly cheap. There is something else at play. It might be explained by design considerations or by user experience flaws or integration but something is different.
—
If you’d like to learn more about the Asymco method, come to Asymconf. The next Asymconf will be at the end of January near San Jose. Not only will you learn about how mobile is disrupting computing, you will also get to hobnob with the likes of Om Malik, Jean-Louis Gassée and Michael Lopp.
Discover more from Asymco
Subscribe to get the latest posts sent to your email.

