In the post “Google vs. Samsung” I compared the profits of Google and Samsung Electronics’ mobile (aka Telecoms) division. It showed how Samsung has grown its mobile business to such a degree that, if sustained, could conceivably influence the way Android is controlled.
However, we should not analyze Samsung’s mobile group in isolation of the entire company. Samsung relies on internal transfer of technology and capacities of production which are quite unique for device vendors today. In other words, Samsung is a relatively integrated enterprise. Understanding the whole is necessary before understanding the part.
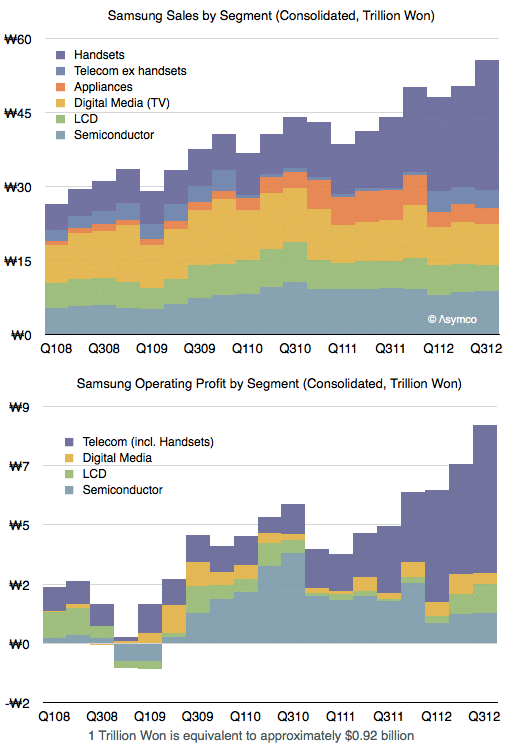
The following graph shows the sales and operating profit for Samsung Electronics as a composite of its divisions since early 2008.
As one would expect, the mobile group (Telecom) is the source of both top and bottom line growth. The group has also been leading in terms of margins and increasing those margins steadily.
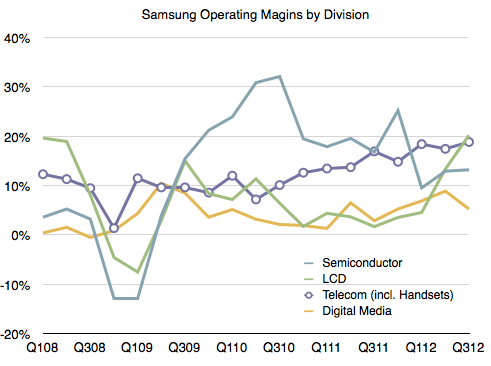
The margins averaged 11% during 2007 and 17% during the trailing four quarters. This 54% increase in margin has been matched by a 55% increase in average selling price (from $151 in 2007 to $234 in the latest quarter).
One could argue however that a 17% operating margin from a group that is now leading in volume and price is still a bit weak. At its peak Nokia enjoyed a 25% operating margin, RIM 30% and HTC 27%. Apple’s iPhone operating margin is around 45%.
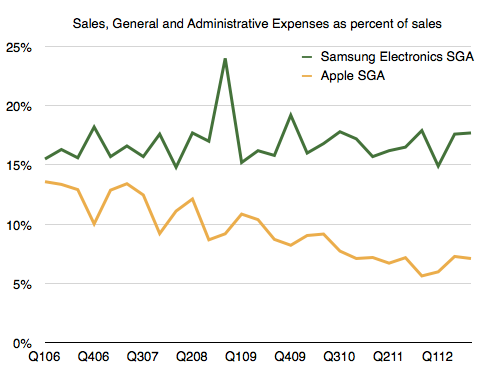
I think a large part of the margin story is a relatively high level of spending on SG&A (Sales, General and Administrative) which includes advertising, sales promotion and commissions. In the case of Samsung Electronics, as sales has grown these expenses have grown in proportion. As a percent of sales SG&A have held relatively steady at around 17%.
Note that as Apple’s sales have grown its SG&A has grown less rapidly resulting in a smaller percent over time. We might see Apple’s SG&A drop to 5% during the present quarter, an all-time low.
So one of the more remarkable aspects of Samsung’s success has been their willingness to increase promotional spending. Considering that their other divisions don’t require as much “marketing expense” (semiconductors, LCD certainly, and TVs and Appliances to a lesser degree due to a smaller sales growth) we can imagine that the vast majority of this promotional spending has been in support of their mobile brands, Galaxy in particular.
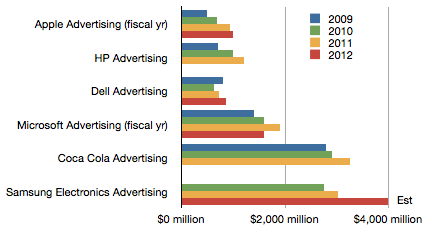
In fact, we can obtain advertising spend data from annual reports.
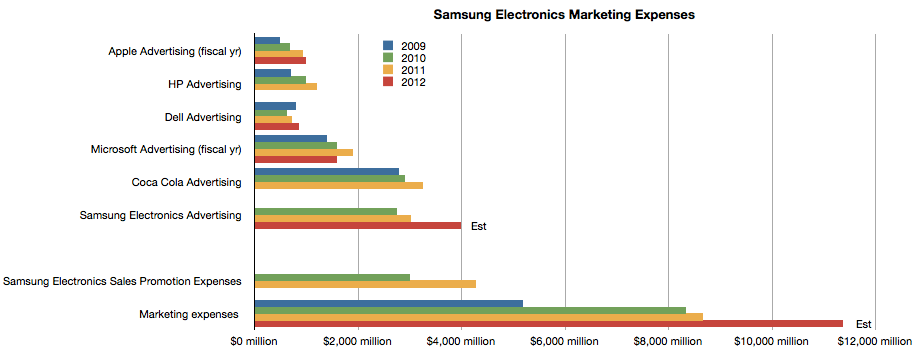
The chart above shows comparable ad spending from a cohort of technology companies as well as Coca Cola and Samsung Electronics.
It might be surprising to note that Samsung spends considerably more than Apple and Microsoft. But it also spends more than Coca Cola, a company whose primary cost of sales is advertising.
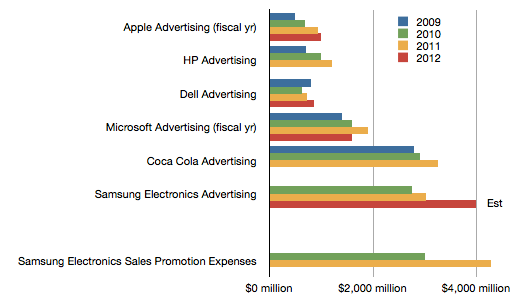
However, advertising is not the only form of promotional spending. Samsung also pays commissions and “sales promotion“. The following chart shows the value of these sales promotions relative to the ad spending budgets above.
We don’t have data on the current year since that is released after year’s end, but it’s interesting to note that promotions cost more than ads, which themselves are substantial relative to other companies.
The company also reports “Marketing Expenses” every quarter[1]. These figures appear to be the sum of Ad spending, Sales Promotions, Public Relations and a portion of “other” expenses as a part of SG&A.
When considering all marketing expenses, Samsung Electronics’ sales efforts begin to look quite astonishing.
—
Notes:
- The data used in the latter three charts are available as a Google spreadsheet here.
Discover more from Asymco
Subscribe to get the latest posts sent to your email.

