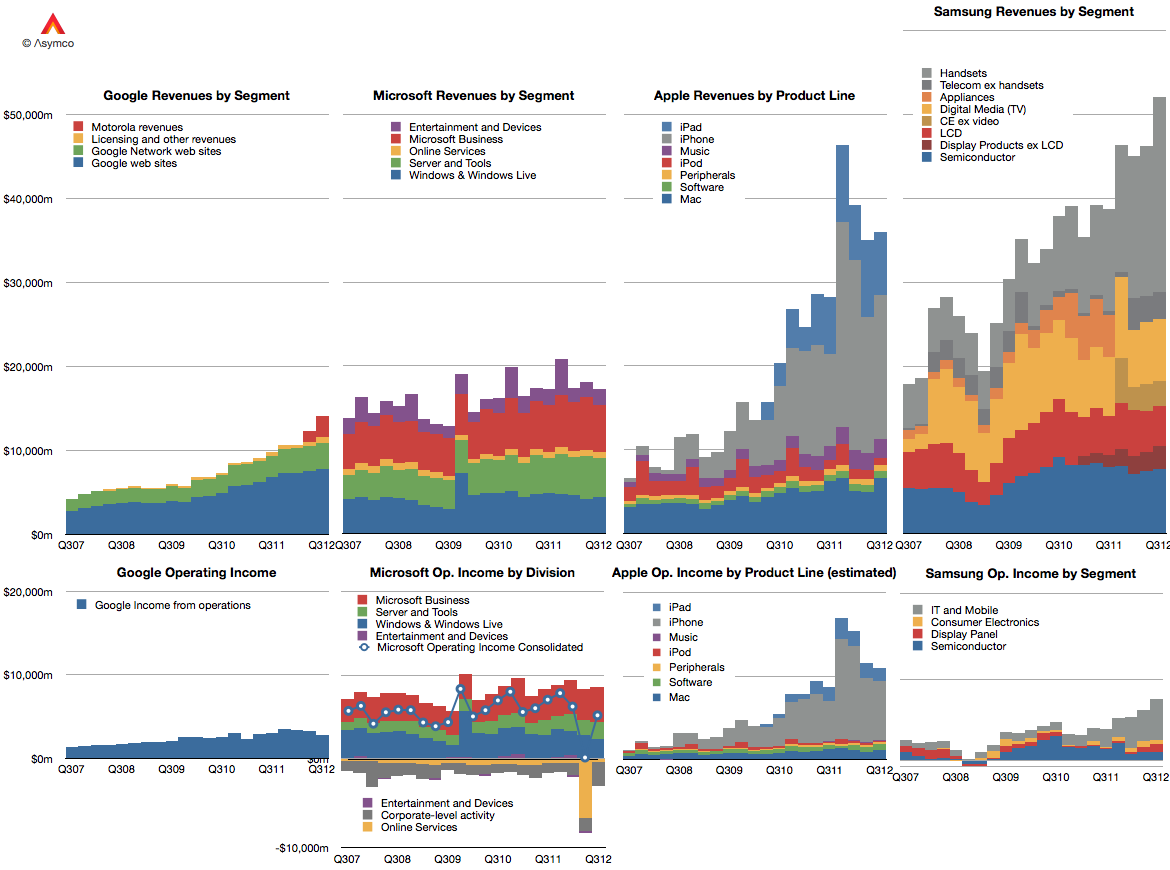
As first introduced last week, Samsung’s revenues have grown primarily due to the expanding volumes of smartphones. In today’s post I convert the revenues and operating incomes to US Dollars and compare them to a set of companies.
First, I should note that Samsung has changed both the designation of its divisions and the way it reports revenue. Broadly speaking, Samsung Electronics has four major divisions:
- Semiconductors. This includes memory products as well as systems such as CPUs.
- Display products. This used to be called “LCD” but has been re-named Display Products.
- Telecom. This is mainly mobile phones but includes additional products and services for telecom operators and PCs. The division has recently been re-named IM (IT and Mobile communications).
- Consumer Electronics. This group has changed names from Digital Media and Appliances to CE. The majority of sales value comes from televisions but also includes consumer electronics and appliances.
The company further combines Semiconductors and Display Products into a group called DS (Device Solutions) and Consumer Electronics and IM into DMC (Digital Media & Communications).
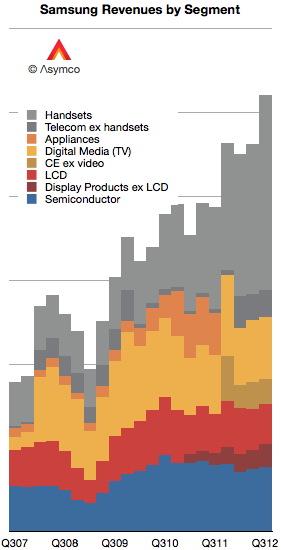
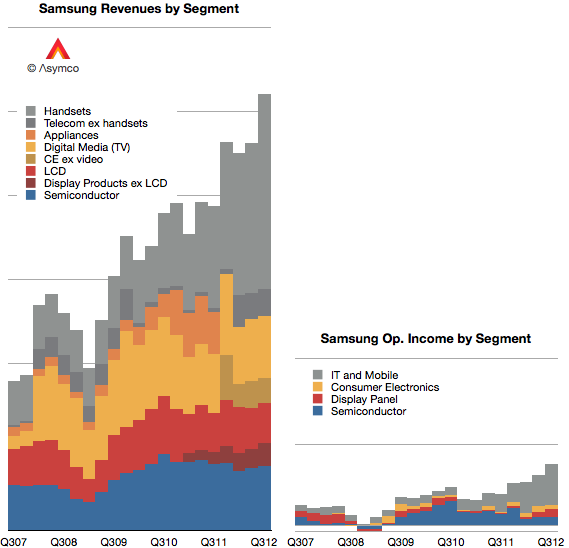
I tried to reconcile these various nomenclatures with color coding in the following graph. Semiconductors are blue, Display components are red, Consumer Electronics are Yellow and Mobile are grey.
Each gridline represents $10 billion.
One more point to note about revenue recognition: Relatively recently the company has switched from reporting consolidated revenues to gross revenues. This means that current sales include inter-segment sales. So, as much as it is possible, the data above shows sales from division to division as well to external customers.
When it comes to reporting operating income, the company offers four segment values: Consumer Electronics (Appliances, TV, “Digital Media”), IT and Mobile (including mobile phones), Display Panel (formerly LCD), and Semiconductor.
I used the same color coding to show the income values in the same scale as the graph showing income:
It’s now possible to compare Samsung Electronics with Google, Microsoft and Apple in terms of divisional (as a proxy for product-line) revenue and profitability over a five year period.
At this time, a portion (majority?) of Samsung’s grey area in the operating income graph represents the vast majority of profits obtained from Android across the entire ecosystem.
Discover more from Asymco
Subscribe to get the latest posts sent to your email.


