Having described the Revenue, Operating Margin and cost structure for Samsung Electronics it’s time to review their investment strategy.
The Economist summarized it well:
[Samsung’s] businesses look remarkably disparate, but they share a need for big capital investments and the capacity to scale manufacture up very quickly, talents the company has exploited methodically in the past.
Samsung’s successes come from spotting areas that are small but growing fast. Ideally the area should also be capital-intensive, making it harder for rivals to keep up. Samsung tiptoes into the technology to get familiar with it, then waits for its moment. It was when liquid-crystal displays grew to 40 inches in 2001 that Samsung took the dive and turned them into televisions. In flash memory, Samsung piled in when new technology made it possible to put a whole gigabyte on a chip.
When it pounces, the company floods the sector with cash. Moving into very high volume production as fast as possible not only gives it a price advantage over established firms, but also makes it a key customer for equipment makers. Those relationships help it stay on the leading edge from then on.
The strategy is shrewd. By buying technology rather than building it, Samsung assumes execution risk not innovation risk. It wins as a “fast follower”, slipstreaming in the wake of pioneers at a much larger scale of production. The heavy investment has in the past played to its ability to tap cheap financing from a banking sector that is friendly to big companies, thanks to implicit government guarantees much complained about by rivals elsewhere.
Can we find evidence of this capital intensity?
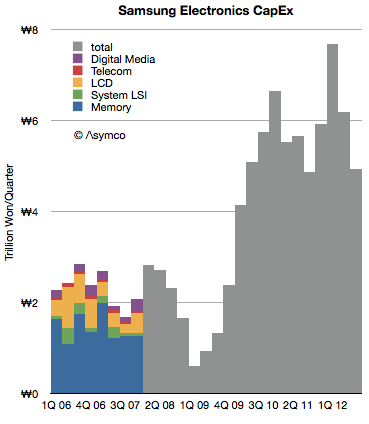
To answer, I reviewed Samsung Electronics CapEx as reported in their quarterly cash flow statements. The following graph illustrates the data:
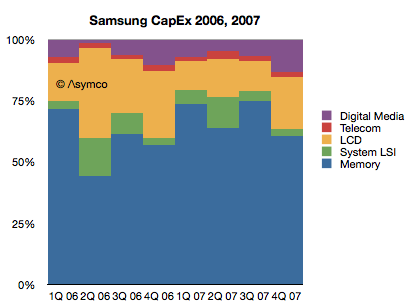
Note that during 2006 and 2007 the company specified expenditures on an operating divisional level. Since 2008 it has reported only a total. For the years where divisional detail is available, the percent split looks as follows.
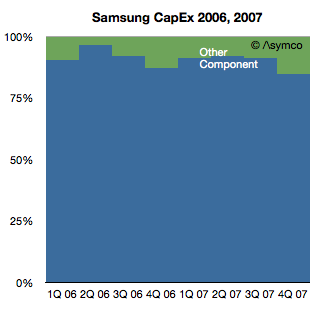
If we combine the Semiconductor division (Memory and System LSI) with the LCD group and classify this as “components” the split looks as follows:
Therefore, for the two years when information was available, the component divisions consumed 91% of expenditures and Consumer Electronics (Digital Media) together with the Telecom (mobile phones, mainly) were a combined 9%. The least capital intensive division was Telecom, the mobile phone group, with only a 2% allocation of capital.
The other observation is that, after a contraction in the recession years of 2008 and 2009, CapEx expanded greatly in 2010 and 2011. [1]
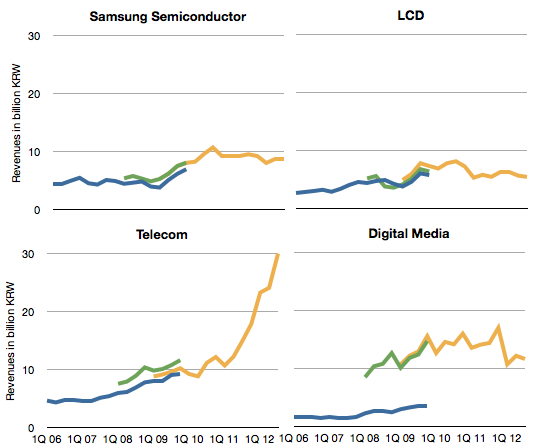
Coincident with the growth in CapEx, the company’s revenues grew dramatically as well. However, as the graphs below show, the growth has come predominantly from the Telecom division.[2]
I calculated the correlations between each division’s revenues and the growth in CapEx (total) for the time periods 2006 to present and 2008 to present and obtained the same results: The division with closest correlation to CapEx remains the Semiconductor group.
This stands to reason. Capital expenditures are mainly in the service of semiconductor manufacturing. Semiconductors, or components in general, require more capital than assembly of devices or consumer electronics.
However, the revenues and operating income for devices have grown far faster. Samsung’s investment in capacity would have been largely profit-free had they not also been assembling the devices which capture the margins.
One might conclude that Samsung would be better off abandoning its capital-intensive components business and focusing on the devices. However, as James Allworth points out if you only do the devices, you may find yourself vulnerable to value chain disruption. Whoever is involved “upstream” in the value chain will inevitably learn the device business from a base of “commodity” manufacturing and pose a threat.
Now the question poses itself: Which of the usual suspects understands this?
Stay tuned for evidence of an incumbent response.
If you want to learn more about the future of the technology industries and the evolution of value chains, consider participating in Asymconf.
—
Notes:
- Some of this growth is due to a new (K-IFRS) accounting standard in use after 2010, but the expansion was significant regardless.
- The revenues data is was reported using three different accounting methods and each is shown with a different line color: Blue is “Parent basis”, Green is “Consolidated basis” and Yellow is “K-IFRS”.
Discover more from Asymco
Subscribe to get the latest posts sent to your email.


