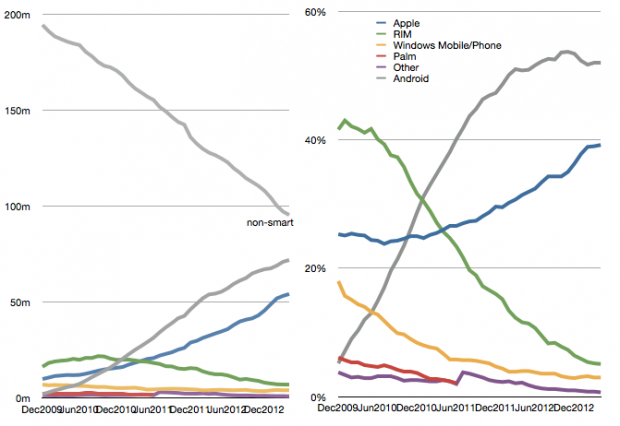
The latest comScore US smartphone install base data is in and there are few surprises. iPhone has reached a new record high penetration (39.2%) and user base (54.3 million). Android has reached a new high in user base (72 million) but share at 52% is below the peak reached in November 2012.
This pattern of gradual iPhone share gain in the US has been consistent for over two years even while Android has catapulted into an overall lead. The surprising thing is how Android seems to have peaked in share. There are still 95 million non-smartphone users and there seems to be headroom for growth even though the other platforms have been tapped out. But it does not seem that Android phones have any particular advantage over iPhone. My hypothesis remains that as price is taken out as a differentiation, the adoption of iOS is slightly higher than Android.
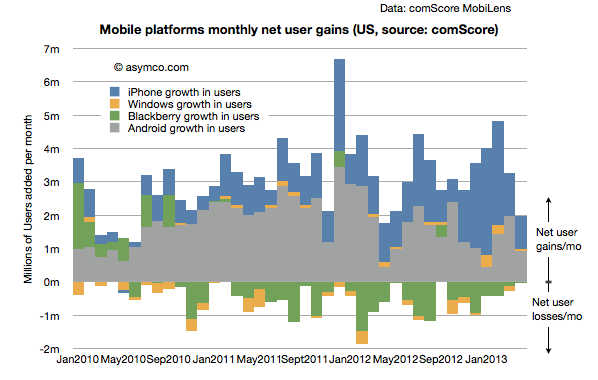
Another measure of market performance is the implied net platform user gains which is shown below:
It shows that iOS added more users in the last few months than Android.
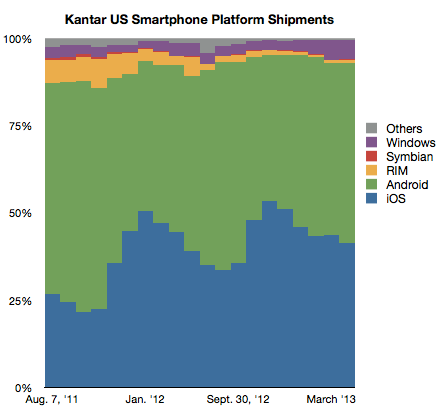
The problem is that Kantar Worldpanel measures shipments and their share data shows a seemingly different picture.
In their data Android is shown as selling more units during January through April while Apple sold more during October through December. Of course we don’t have the absolute number of units so can’t see the effect of higher holiday overall sales volume. Nevertheless, the balance of growth seems to be disproportionately in favor of Android relative to the data from comScore.
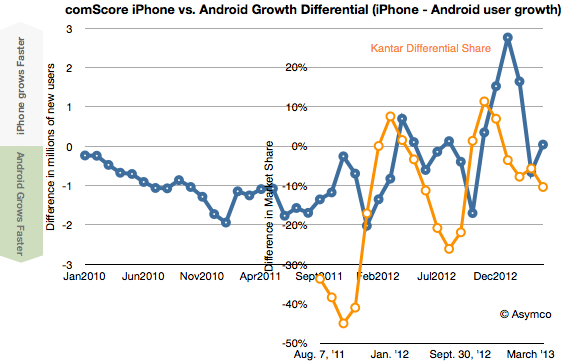
To look at the situation more closely I measured the differential in user adds for comScore and the differential in market share for Kantar’s data. Then I overlaid the two differentials so that months are matching, as shown below:
There is a similarity to the frequency of oscillation with comScore data showing a delay (as would be expected since their data is sampling over a three month period). However, we are still facing a vertical offset where there is apparently more growth bias for iPhone in the comScore data.
Possible factors which might be explanatory:
- Methodologies used. comScore data excludes ages below 13 and non-personal devices (business expensed phones.)
- Replacement sales are invisible in comScore data since the user base does not change when phones are replaced (and old ones are discarded.)
- Missing data from Kantar. Given their survey methods it’s possible that their panels miss some market segments.
Discover more from Asymco
Subscribe to get the latest posts sent to your email.


