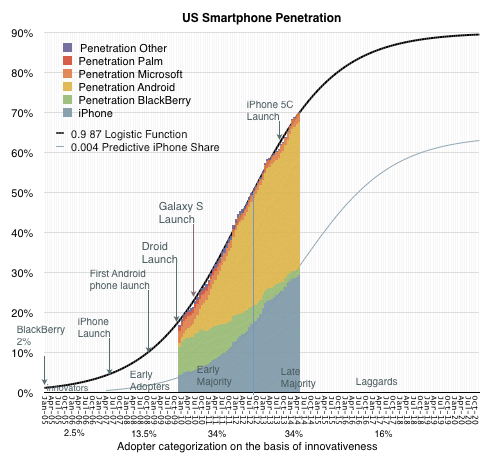
Seven years after the iPhone was launched, 70% of the US population is using smartphones. Smartphones existed before the iPhone so the category is older than seven years but as far as adoption goes this is nearly the fastest ever.
The CD Player reached 55% in seven years and the Boom Box about 62%. If measuring the period between 9% penetration and 90%1 the smartphone in the US will have a lifespan of about 9 years starting in 2008. Before this period, the product was largely experimental and participating vendors2 mostly failed. After this period most products will be “commoditized” with decreasing margins and increasing consolidation.
The rapidity of growth is all the more remarkable given the penetration is at the individual, not household level. The total user base is therefore over 270 million rather than the 115 million usually targeted by consumer technology, nearly 60% more purchases. This is also remarkable because the product has a shorter lifespan of use (two years) than is typical for other consumer technology products3
We are therefore now in the “Late Majority” phase of the US market. This is not a surprise. The inflection point in the market occurred in mid 2012 so we’ve been in this phase for two years already. It’s not therefore controversial to predict two years of continuing though decelerating growth.
As Geoffrey Moore explained, the marketing of technology products needs to be varied as we get into different phases of the market. Innovators (first 2.5%) need to be sold on the premise of novelty itself. Early adopters (next 13.5%) seek status and exclusivity. Early majority (34%) seek acceptance and Late Majority (34%) seek pragmatic productivity. Laggards (last 16%) seek safety.
One aspect of this adoption cycle that is misunderstood is the role of pricing. The assumption is that pricing matters more as adoption increases. This is misunderstood because pricing always matters and therefore it never matters. Pricing is one of many elements of marketing mix and at any time there are product choices across a wide spectrum of pricing. Pricing is also a signal which can be elaborately obfuscated through bundling and unbundling.
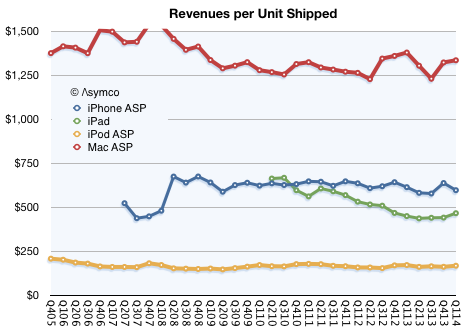
One way to illustrate this is to consider how Apple products behave in the late phases of markets. Apple products have notoriously firm pricing.
The revenue per unit of Macs, iPods, iPhones and iPads remains stubbornly consistent. This is not to say that each unit sold is the same price. The company tweaks “the mix” of mid, low and high products to keep the average selling price constant. But fundamentally the average remains constant which means that regardless of market phase, Apple retains its margins.
So as we look forward to the last two years of growth for smartphones, how will Apple fare?
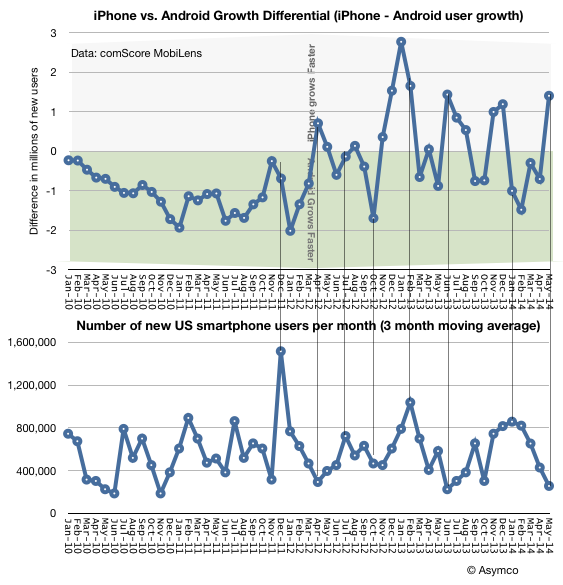
There are weak signals that it will do rather well. I looked at two sets of data for clues: the number of new-to-smartphone users being added each month relative to the increase of usage of either iPhone or Android.
[Edit: The title of the second graph above should be “Number of new US smartphone users per week (3 month moving average)”]
What I’m looking for is a relationship between the rate of adoption of the overall product and the rate of adoption of iPhones. I measured the new-to-smartphone users as the change in user population (per week) and the preference for iPhone as a growth differential.4 The data shows no perceptible correlation between adoption rate and preference for either platform, however when looking closer there is a periodicity to the addition of users, especially starting in 2012.
The range is not insignificant, ranging from ~300k users/week to well over 1 million. The periods of growth of users could be due to new product launches or incentives and promotions done by the mobile operators. Whatever the reason, there is some flux.
If we look at the corresponding adoption differential in platforms the relationship seems to be that peaks in adoption are matched to Android preference and troughs to iPhone preference. This might seem logical: after the 50% saturation point, when promotions are run by operators, non-consumers are drawn in and they tend to adopt the “low-cost” product.
However, this is also paradoxical. Why, when we are in a late stage of the market, does the iPhone do well when users are not incentivized to adopt? The graph above shows that as we crossed 70% adoption, 1.4 million more users adopted the iPhone than Android.
Even if we look out to the last six months, iPhone added 15.5 million late majority users while Android added 14.2 million. If promotions decrease for the “late late majority” and laggards then would the iPhone do even better relative to Android?
The only answer seems to be that “low cost” is not what’s driving this market. But then again, it never did. Towards the end of the “pre-smartphone” market the most wildly popular voice phone in the US was the RAZR. And it was a premium product.
- which I consider the “economically attractive” period of growth [↩]
- Palm, BlackBerry, Nokia [↩]
- e.g. TVs, Refrigerators, Radios, etc. [↩]
- iPhone growth in millions of users minus Android growth in millions of users. Positive data points suggest iPhone grew faster in a period and negative points suggest Android grew faster. [↩]
Discover more from Asymco
Subscribe to get the latest posts sent to your email.


