At WWDC 2016 Apple offered a set of new data points to illustrate its ecosystem’s robustness.
First, the number of registered developers increased by 2 million in the last year to a total of 13 million. That is a growth rate of 18%. To compare this total consider that Oracle claimed in 2014 9 million Java developers and IDC claimed in 2014 there were 18.5 million software developers in the world, of which 11 million were professional software developers and 7.5 million were hobbyist developers. It’s therefore possible that Apple’s “market share” among developers is close to 70%.
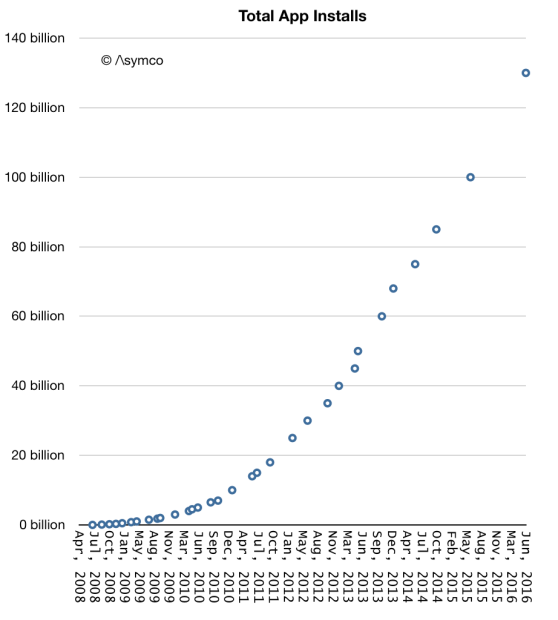
Second, App installs have now reached 130 billion. The cumulative growth is shown in the graph below:
The rate of growth is also shown in the following graph:
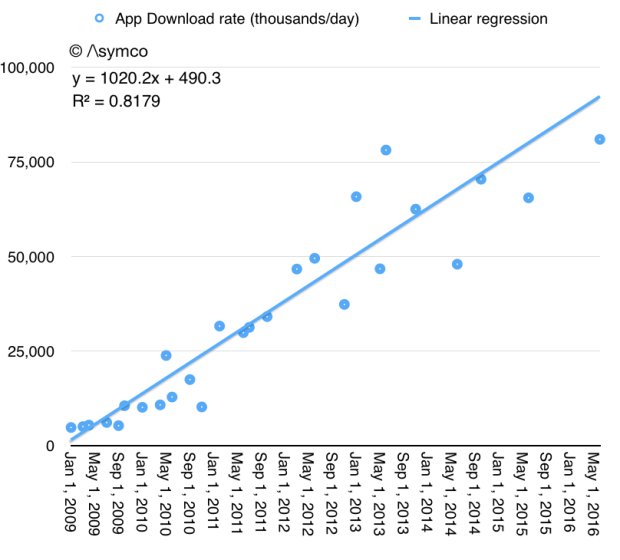
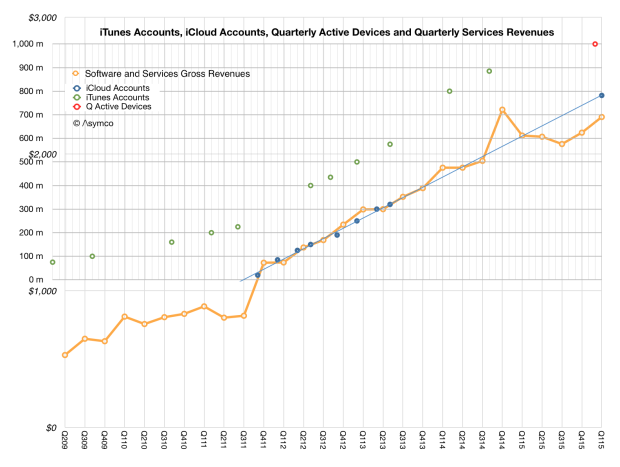
Note that the rate of growth continues to increase and is now above 30 billion/yr. It turns out that apps continue to be a popular download item. The size of the audience continues to grow (see graph below) and it’s therefore understandable that activity in the store continues to grow.
Third, the rate of payment to developers has also increased to over $20 billion/yr., with the total payments having reached $50 billion. 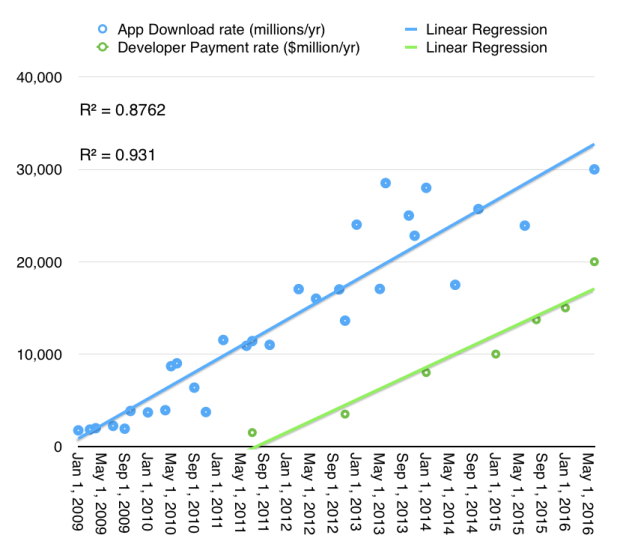
The graph above shows the derived payment rate (in green) relative to the download rate (blue). Although not completely parallel, the overall correlation is plain to see.
Fourth, there are more platforms than ever (four device and three services). As a result, Apps and services continue to outgrow traditional content revenues. Gross revenues for iTunes/Apps/Software/Services/Licensing is shown below:
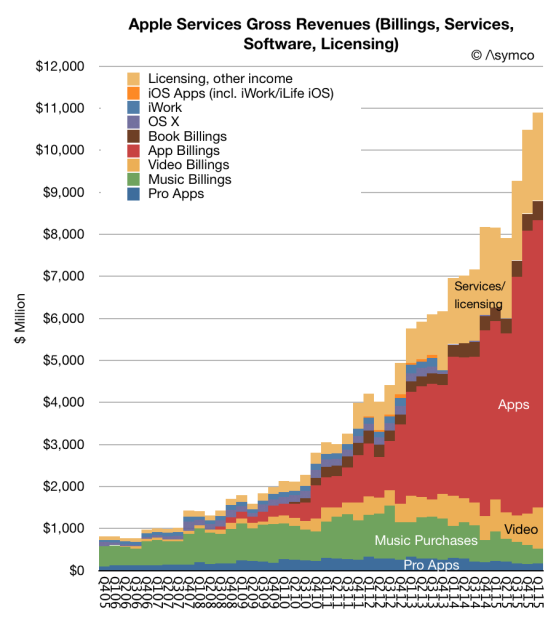
Overall, economic activity transacted directly through Apple’s platforms is approaching the run rate of $40 billion/yr. It continues to grow at about 20%, so it’s foreseeable that it will reach at least $50 billion/yr.
It’s hard to compare to other ecosystems as metrics vary but this rate alone places Services as one of the larges businesses in the world (service or otherwise).
There are other ecosystems “on top” of iOS which transact outside the Apple systems (and hence are not reported in the total above). These include Facebook, Google, Uber, Amazon and other economies which use iOS devices to enable engagement. These add up to hundreds of billions of dollars in transactional value. My estimate is that all mobile services are at least $250 billion/yr today and will reach $800 billion/yr in 2020. Apple is and will continue to be the home or enabler to the majority of this revenue.
But the more profound point to be made is that this ecosystem relies mainly on direct payments by the beneficiaries of the service or content. Apple contents itself with the $35 billion it can transact through its own storefronts because it feels that the business models are compatible with its brand.
When it comes to all the ways of “monetizing” platforms, this may be a very conservative strategy but it’s one that also avoids the potential pitfalls of social scandal.
Discover more from Asymco
Subscribe to get the latest posts sent to your email.
