As shown in the Apple growth scorecard, the company’s earnings growth is continuing at 75% with the top line increasing at the annual rate of 70%.
The $59 billion of cash on the balance sheet has reached the equivalent of $64 per share yielding an enterprise value of $263 per share based on closing price of January 21st.
The stock price has been rising but not outside a narrow P/E band. The following chart shows the stock price and the 15 P/E and 25 P/E bands that have bounded it for nearly three years.
As previously observed, this overall share appreciation is not accounting for the growth in earnings.
The trailing twelve months’ earnings were $17.91 per share. Therefore the P/E ratio is now 18.2. Excluding cash, the P/E is at 14.7. However, that’s based on 2010 levels of earnings. Those earnings are increasing very quickly.
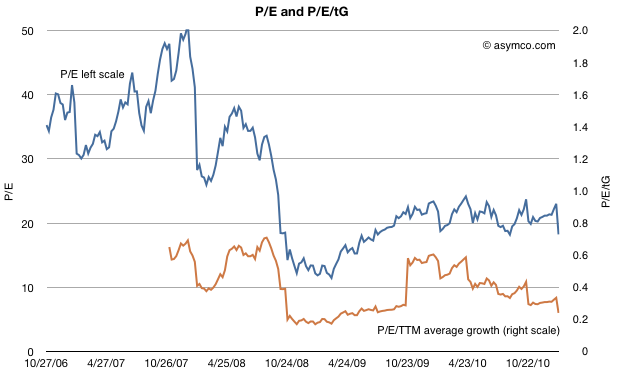
To account for earnings and their growth, I developed the following chart which shows the P/E and P/E/trailing-Growth for the stock.
The P/E is fluctuating on either side of 20 but when considering trailing growth, comparable companies, the macroeconomic conditions and guidance the value of the company is reaching new lows.
P/E/tG nearing recession lows
Earnings were 75% higher in 2010 than the year before. So based on the growth, the rule-of-thumb ratio P/E/trailing Growth (P/E/tG) is 0.24. This ratio (where 1.0 is seen as “fair value”) is the lowest since July 2009, during the first months of recession recovery. The trend for this ratio is down (see the burnt orange line in the chart above). It’s not far from hitting the lowest point during the recession at 0.17.
Now I’d like to reminisce a bit about that point in time. The stock had bottomed at $78/share[1]. It was trading at barely 3x cash and a P/E of 11 but growing 3x that level (32% in the slowest recession quarter but averaging much higher).
So today we are at a similar point in valuation. The cash is at $64/share, shares are priced 5x that amount and the growth is 4x P/E[2]. Although analyst targets are less comical, there is still the sense of extreme despondency when looking at the valuation ratios.
Guidance, Comparables and Macroeconomics
Unlike two years ago there aren’t the same dark clouds on the macro horizon. The company is also not as cautious on its guidance (guiding 63% EPS growth must be a new record for a post-holiday quarter) and there is talk of bubble in valuation for comparable companies. Netflix, Amazon, and ARM have eye-watering valuations relative to growth.
A discount to the S&P 500
And to round out the tragic tale, Apple’s P/E is, once again, at a discount to the S&P 500 P/E (14.7 vs. 16.57 respectively).
Given the new low in valuation contrasted with optimism on behalf of many (including management), on some forums there is discussion about Apple becoming the target for a take-over.
There is some perverse merit to this logic. With $64 in cash, $25/yr in earnings and 75% growth it’s so cheap that if credit were available, it would make a tempting candidate. Private equity could take it private and use the gigantic cash flow to pay off debt (in about four years). In bygone days, this would have been an easy pitch.
Alas, the capital markets may not have liquidity for the size of the market cap Apple holds and I don’t see any competitors able to get the leverage for an acquisition either. Or can they?
—
Notes:
- In early summer 2009 some analysts put 12 month targets for the stock at $70, so their predictions were within $6/share to today’s book value.
- A buyer of shares two years ago would only have to wait two years to have 80% of their investment sitting in retained earnings. An investor who read the data from Apple and knew that the iPhone existed could not fail but be amazed.
Discover more from Asymco
Subscribe to get the latest posts sent to your email.


