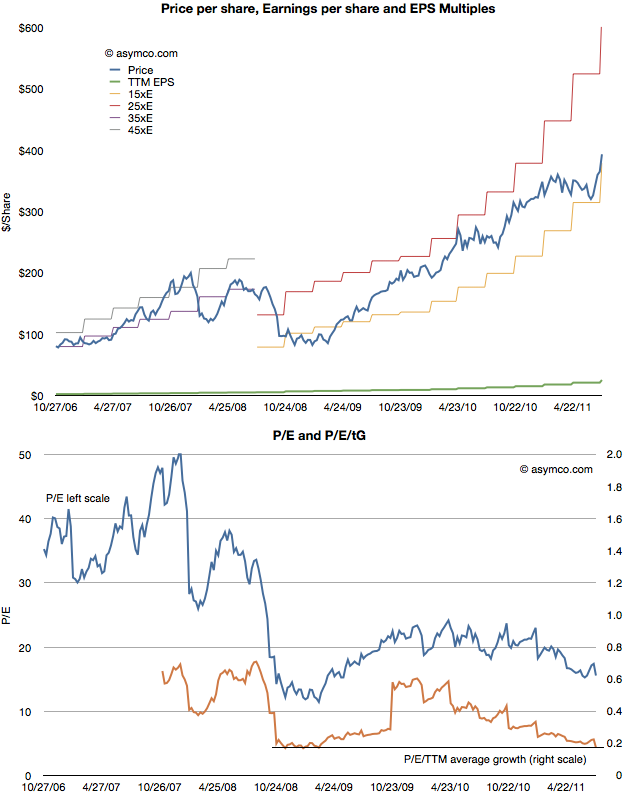
After Apple reported earnings growth of 125% its share price dropped to a P/E of about 15. This reduction in valuation is part of a trend I’ve written about for over a year so there were no surprises. The first chart below shows how the stock has traded between increasingly lowered P/E bands.
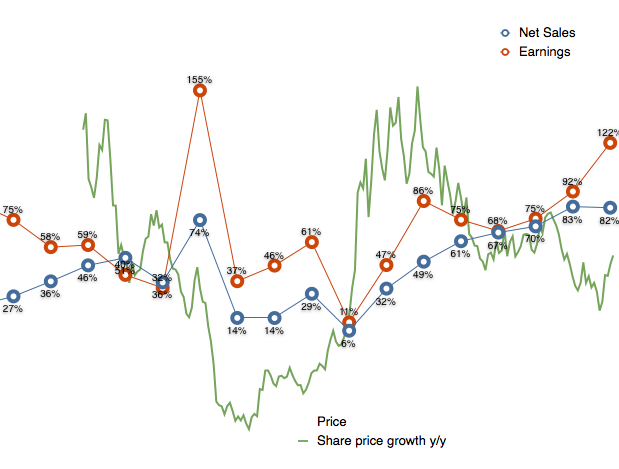
As the second chart shows, not only is the P/E ratio declining, but when seen against the trailing twelve months (TTM) average growth rate, the P/E/TTM ratio is now at the lowest since the great recession (around 0.17–a value of 1.0 is a rule of thumb for “fair value” in a growth stock).
Those values include cash. Excluding cash, the P/E as of Friday was 12.4. On a forward basis (my estimate–which has shown be be conservative lately) the P/E is around 7.
Perhaps some day in the future investors will come around to looking at Apple as a growing company, but there has been no such inclination for over two years. As I’ve pointed out numerous times, growth and valuation are moving in opposite directions.
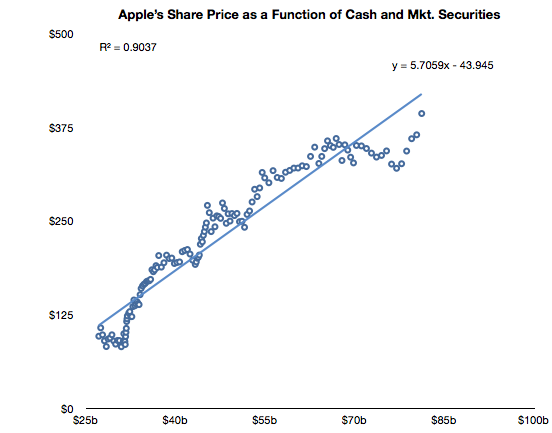
The only correlation to the stock price has been found on the balance sheet, not the income statement. Looking again at the relationships between cash and the stock price, we see a clear relationship (r squared of .9)
After a lapse during the first quarter, the relationship that has been in place since October 2008 is returning.
Note the formula of the trendline which allows some interesting guesses on what the stock price will be. For example, putting $95 in cash per share results in a share price of $500. Let’s see if the relationship holds until then.
Discover more from Asymco
Subscribe to get the latest posts sent to your email.


