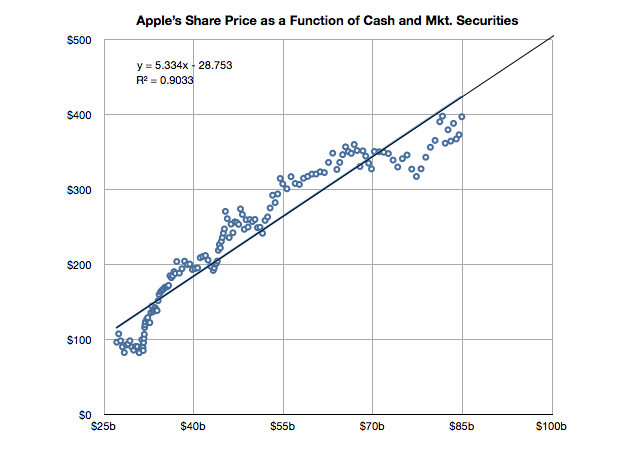
Apple’s share price has recently hit a new all-time high, over $400 per share. As often happens there was no specific new information from the company to justify this increase. On the other hand there is usually no news to justify share price drops in Apple. In fact, the stock is up on what would be considered counter-indicative news: the resignation of a very important CEO.
But readers may recall that there is a measure of performance for Apple we can turn to that seems to show strong correlation to its stock price. It’s not income and it’s not growth in income but it’s the strength of the balance sheet.
I demonstrated this relationship last May with a post titled The market values Apple’s balance sheet, not its income statement.
It’s time to look at the data again to see if the relationship still holds. I added the data for Q2 and made some estimate about the cash position since July 25th (we will know this data with more accuracy when Q3 data is reported in a few weeks).
The slope of the line above has decreased slightly but a strong correlation can still be observed. The old r-squared was 0.94 and it is now 0.90. I included the formula for the y variable (share price) as a function of x (cash).
If you plug in $100 for x you get about $500 for y. So if this relationship continues[1], the answer to the question in the title would be “When the cash and cash equivalents reach $100 billion.”
—-
Note:
- Note that whether the relationship holds (which it very well may not) depends on a strong correlation and “strong” is not well defined. The correlation has weakened slightly in the last six months.
Discover more from Asymco
Subscribe to get the latest posts sent to your email.

