The US is a crucial market for both Nokia and Microsoft’s strategies. This importance was highlighted during the launch at CES in January when not one but three CEOs (Microsoft’s Steve Ballmer, Nokia’s Stephen Elop, and AT&T’s Ralph de la Vega) were on stage to launch the Lumia. Knowing how well this strategy is working would be very useful to understanding how this market behaves.
My first take on this was when I asked the question How many Lumia phones were sold in the US? The answer suggested through the combination of survey data from Nielsen and comScore[1] was 330,000. The figure is quite small compared to expectations. As it’s so extraordinary, it should be supported by good evidence. Unfortunately the methodology used is weak. The figure itself is probably close to the margin of error of such sampling techniques. It would be nice to have another way to calculate this.
Today Nokia offered another set of data which might help determine how many Lumia phones were shipped in the US. (Note the shipped versus sold distinction. Companies report shipments while surveys nominally measure consumption or usage.)
Unfortunately, Nokia did not offer specific data on US shipments. What they did offer was:
- Global Lumia shipments were 4 million in the last quarter
- Global average selling price was €186 for a Lumia phone
- North American[2] phone shipments were 600k. This includes all phone types and all operating systems.
- North American sales were €128 million.
That’s all we have. So how can this help with the question of US shipments?
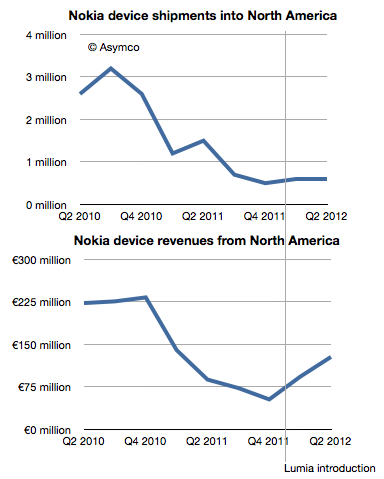
As often happens, it helps to look at the data historically. The following charts show North American shipments and sales with the Lumia launch date highlighted.
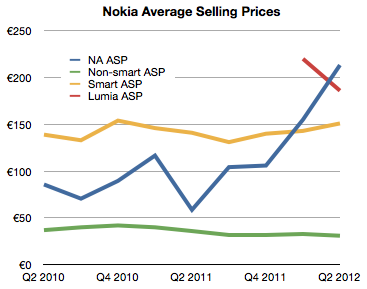
While unit shipments were flat, revenues increased significantly. This suggests that we could plot the average selling price of phones in North America (NA) specifically. I did that in the following chart:
Here the effect of Lumia is clear. The average revenue per phone in the US (blue line) jumped dramatically after the launch. So much so that it actually overtook the average global ASP for Lumia.
What we need therefore is a way to estimate the “mix” or percent of smart and non-smart phones sold into North America and derive perhaps the US portion of that and then finally try to separate the Lumia from all the smart volumes.
To help, I plotted the historic ASP for Smart and non-Smart devices as provided by the company.
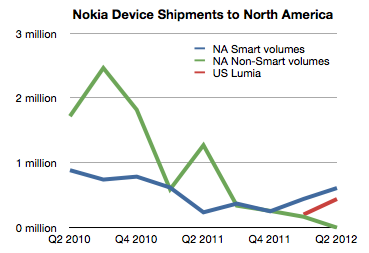
Using a simple formula[3] it’s possible to derive the mix which is shown as Green and Blue lines in the following chart.
Getting estimates for smartphone shipments (blue line) is pretty close to Lumia shipments, but we still have to correct for US/Canada split (estimated at 90:10) and Symbian/WP split among smartphones (estimated 50:50 in Q1 and 20:80 in Q2).
The result is the red line showing US Lumia shipments. The sum of the two quarters then comes to 630k.
This is nearly twice the estimate from consumer survey data however I would not draw too many conclusions from this. Mainly because there are many assumptions place in both estimates, but also because there is the distinction between shipments and usage.
However, it might be safe to say that US install base is somewhere between 400k and 1 million users. Is this good or bad?
It’s good because it’s progress and there is some growth. It’s bad because it’s frightfully small relative to the competition. Nokia itself acknowledges the challenge and states that “We believe the Windows Phone 8 launch will be an important catalyst for Lumia.”
It seems that what Nokia needs most today is time. That is a very expensive asset. Perhaps infinitely so.
—
Notes:
- A practice neither company would condone, principally because they are competitors, but also because they use different sampling methods.
- North America I take to mean US and Canada. Although geographically, Mexico is part of North America it’s usually grouped as part of Latin America as a category. I’d like to get this confirmed.
- There are a few implicit and explicit assumptions: (a) Global ASPs are roughly comparable with NA ASPs but (b) smartphone ASPs are higher in NA by about 30%
Discover more from Asymco
Subscribe to get the latest posts sent to your email.


