Tim Cook is quoted as having said the inventory is not only evil but that it’s fundamentally evil.
With just-in-time production inventory can be reduced, at least work-in-progress inventory. Unfortunately inventory cannot be completely eliminated. The fact remains that you sometimes need to stockpile product for launch and need to have some on hand depending which way it’s sold. There is also substantial channel inventory (which is off Apple’s books but still evil) that needs to be in the hands of distributors.
Tight inventory management has become a characteristic of Apple and that contributes to getting ranked number one in Supply Chain Management. So we can expect that Apple runs a tight ship. In fact we have evidence of this through the ability to track our purchases from when they ship out of a factory in China all the way to our homes.
This tracking in itself shows that when product is in high demand production is initiated on direct consumer orders not just in response to maintaining a level of inventory. So with that in mind, we can revisit the question of how many iPhones 5 the company has produced.
First, we need to step back and recall the method for analyzing production. I built a model which attempts to show what a typical production run for an iPhone model would look like. I first published the process in early 2011. It used the historic data from iPhone 1, 3G and 3GS to try to predict iPhone 4 production. I’ve updated the model to show what that would look like today.
The assumptions driving the model are:
- There has to be some inventory on hand during any given month (i.e. inventory cannot be negative.)
- Inventory has to be kept as low as possible. Preferably below one full month of shipments in the month. This rule needs to be broken on launch as there has to be an attempt to meet first month sales, which are usually substantial.
- There is an assumed mix of older variants equal to about 10% of current model sales.
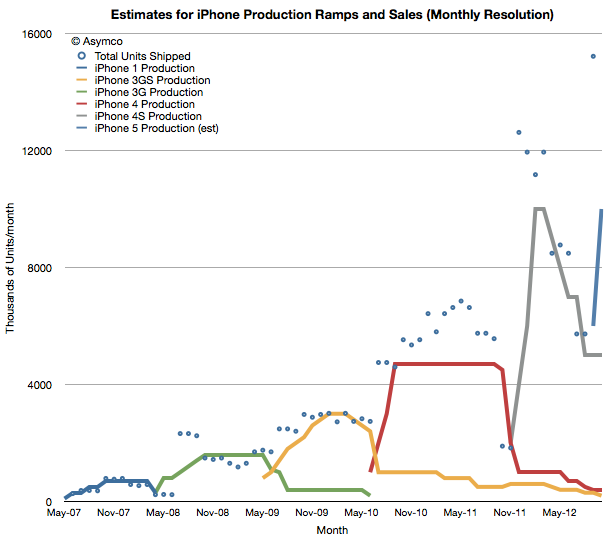
The results are shown below.
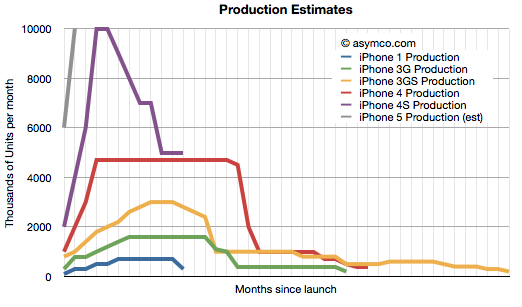
The solid lines are estimated production and the points are actual shipments (the resolution is monthly so quarterly shipment data is averaged over the months covered by the quarter and normalized for the number of days in a given month). Note that each product ramp differs slightly in shape but that overall there is a doubling of peak production. This is shown more clearly in this view where each production ramp is indexed to the same starting point.
The ramps roughly match the shipment data which assumes the JIT production method is being used. Note also that the start of production was roughly double that of the previous product run–consistent also with the spending on capital equipment (Machinery and Equipment as part of PP&E). Note also that the iPhone 4S was more “peaky” with a shorter maximum run than the 4 but that the 3GS also was peakier than the 3.
The iPhone 5 production, shown in grey, assumes 10 million units sold in September and a quicker ramp to maximum run rate. The need to have units on hand led me to assume 6 million units were produced in August and none prior to that. We don’t yet know peak production or duration of peak production but my guess would be that peak will be well above 4S level, perhaps 15 million per month and that the run will be longer than the 4S.
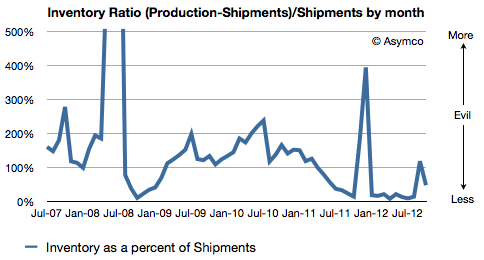
The maximum inventory on a monthly basis runs to about 6 to 7 million for the iPhone 5 but as a percent of total shipments, I’m assuming the performance is improving over time. The following chart shows this ratio:
For the sake of argument, I would create an equivalency between this ratio and the amount of evil present. My model is based on many assumptions and a mostly a work of (informed) fiction but it would not surprise me that the amount of evil is decreasing.
Discover more from Asymco
Subscribe to get the latest posts sent to your email.


