In the latest quarterly report Apple changed how it reports product revenues. In previous quarters the iPhone and iPad were reported including accessory revenues while iPod accessories were reported under “Music” revenues.
“Under this new format revenue from iPhone, iPad, Mac and iPod sales is presented exclusive of related service and accessory revenue […] revenue from all Apple and third party accessory sales is presented as a single line item [Accessories.]”
Apple provided a document showing re-classified product summary data. By measuring the difference between original revenue and re-stated revenue per product we can determine how much service and accessory revenue was being attached to each product.
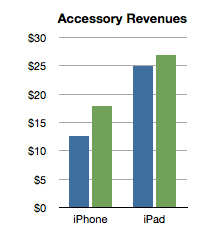
I did this for two quarters as a sample:
The analysis shows that the iPhone has been receiving about $15 of accessory attached value and the iPad about $25. Interesting trivia, but how is this insightful?
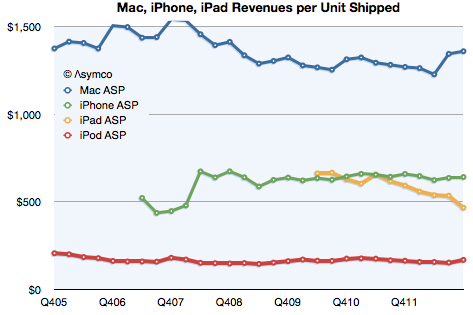
Consider the impact on this analysis of revenues/unit shipped:
The iPhone obtained about $642 revenue/unit (shown above as the last datum in the green line). That compares slightly lower with last year’s $659/unit. However, the latest quarter is on the new basis and the data in the chart above shows old basis.
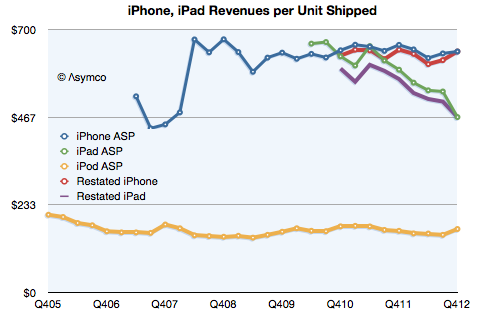
Here is the data with re-stated iPad and iPhone ASP:
On a re-stated basis, without the extra revenue from accessories, the iPhone “ASP” (Average Selling Price) from a year ago becomes $646 (which, again, is not what is reflected in the graph). This is almost exactly the same as the current quarter. The iPhone “ASP erosion” therefore goes from 2.6% to only 0.7%.
Similarly, the iPad shown at $467 in the latest quarter does not drop from $593 last year but from $568. Its ASP erosion becomes 18% rather than 21%.
Interesting resilience with the iPhone and slightly better support for the iPad price. What does it mean?
Pricing power is the most important indicator of differentiation and it implies an ability to create value in excess of cost. Not only that but it also indicates whether a product is being “commoditized” by over-serving the market and being substituted by lower priced alternatives.
In the case of the iPhone the tenacious retention of its ASP indicates that the point of over-service has not been reached. Buyers are not yet switching in significant numbers to the older, cheaper variants available from Apple. If they were we would see evidence in the price first due to the change in mix.
Contrast that with the iPad where there is a far more marked erosion. That’s due to the introduction of the mini which is good enough to substitute for the larger version for many of the jobs it’s hired to do. We can safely argue that the iPad is good enough in smaller form factors and addressing larger markets.
But why isn’t this happening to the iPhone? Why isn’t the iPhone n-1 “good enough”? Surely consumers can do almost the same tasks with an iPhone 4S as they can with the 5. Why are they still buying the new phone?
The clue comes from the fact that the consumer is not the only buyer. It’s operators who buy and re-price the product. They are hiring the product to sell broadband and the newest variant is still the best hire to do that job. This observation is crucial to understanding the growth dynamics of the iPhone and consequently, of Apple itself.
I repeat what I’ve mentioned before: The iPhone is primarily hired as a premium network service salesman. It receives a “commission” for selling a premium service in the form of a premium price. Because it’s so good at it, the premium is quite high. Also because it’s so good, it gets bought in large batches which allow Apple to schedule production efficiently.
This understanding gives us a solid basis from which to evaluate its growth potential.
Discover more from Asymco
Subscribe to get the latest posts sent to your email.


