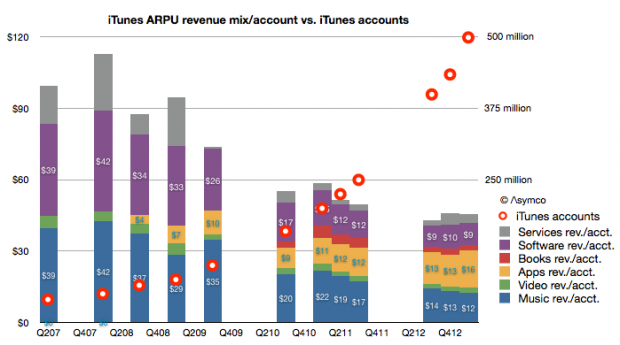
My estimate of last quarter’s iTunes gross revenues suggested a spending rate of $40 per iTunes account. It would make sense to consider how that figure changed over time. The following graph shows the pattern:
You can read each bar in the graph as the total “ARPU” or average revenue per iTunes user[1].
I overlaid a graph showing the total number of accounts as reported by Apple to the (retroactively) estimated revenue structure. Account totals are measured with the right axis and ARPU with the left. Note that I also broke down each component of iTunes as currently defined (Music, Video, Apps, Books, Software and Services.)[2]
The time frame covered is from Q2 2007, or the quarter prior to the iPhone launch. A few patterns emerge:
- When there were no iOS devices (and hence no iOS apps) the revenues of iTunes consisted mostly of music sales. Those revenues were, on a per account basis, roughly comparable with Apple’s Software revenues.
- As iOS devices proliferated, the number of accounts (and users) grew. They doubled in the first two years (2007 to 2009) and doubled again in the following year (2010) and doubled again the following year (2011) and doubled again in the following 18 months. This rate of growth was accompanied by a reduction in the iTunes ARPU of about 50% (from $99 to about $45).
- The reduction in ARPU has moderated in the last few quarters. ARPU fell 10% from $50 to $45 during the last doubling of accounts (from 225 million iTunes accounts to 500 million accounts.) In contrast ARPU fell 20% from $74 to $58 during the penultimate doubling (from 100 million to 200 million)
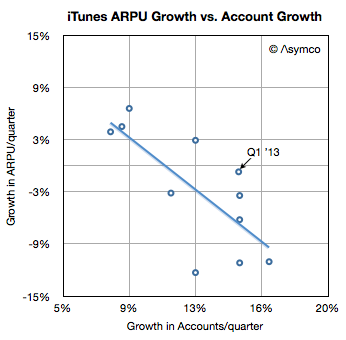
- However, growth in accounts is broadly inversely proportional to growth in ARPU. In other words, the faster the growth in users the faster the decline in ARPU. The recent moderation in ARPU erosion is also coupled to a moderation in user growth (most recent doubling took 18 months vs. 12 months for previous doubling.) This is as would be expected as a broader, later user base tends to consume less than a narrow, early base. This can be seen in the following scatter plot:
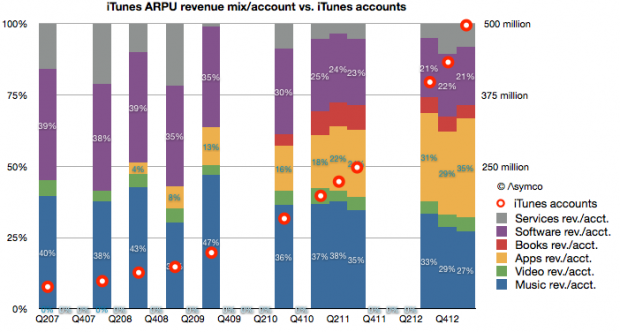
- When seen as a percent of mix, Apps have grown to be the largest component of iTunes spending. Apps have 35% “share of wallet” while music has dropped steadily from 40% to 27% (or $39 to $12/yr.) This is shown in the following graph.
As apps have grown to consume more and more of users’ time it stands to reason that they should consume more and more of users’ wallets.
And as accounts reach one billion, we can begin to think about the disruptive impact on other media types. Whereas video, books and music are targeted to smaller user bases, apps are broadly consumed. Developers like Rovio or Supercell can offer their products to billions while TV producers can only hope for millions. Apps are becoming the universal medium for entertainment and iTunes the universal distributor.
Talent is catching on to this faster than those who manage and distribute their work. The inevitable result will be a mass migration of talent away from the established content industries. Old media won’t fade due to a loss of users. It will fade due to a loss of talent.
—
Notes:
- An account is not necessarily a user so perhaps more appropriately the acronym should be ARPA (average revenue per account). Unfortunately that acronym is taken.
- The complete model is available for purchase through Asymco Store.
Discover more from Asymco
Subscribe to get the latest posts sent to your email.


