Apple vs. Correlation fatigue and the ETF bubble

Recent commentary in financial press (e.g. FT Alphaville » Lost in correlation fatigue and The Herd Instinct Takes OverAmber Waves of Pain)  points out how the markets have become insensitive to fundamentals or valuation itself.

Symptoms of this are:

  • Global markets trading in lock-step.  In an apparent blindness to any local differences, markets from emerging economies to Japan and to London trade in perfect correlation.
  • Crude oil and other commodities are mis-priced due to HFT or algorithmic trading which ignores underlying supply and demand fundamentals.
  • Value investors find that there is lack of dispersion among stocks.
  • Component stocks’ correlation to the S&P 500 is at highest level since ’87 crash, reaching a high of 83% vs. average of 44% since 1980.
  • ETFs (exchange traded funds) maintain (or freeze) over- and under-valuations.

Structural changes such as the proliferation of exchange-traded funds and super-rapid computer-based bloc trading, activities that are totally unconcerned with valuation metrics and/or long-term trends, are still taking place and there is little or no prospect of this development coming to an early end.

  • Adam Smith’s invisible hand has for the time being, been handcuffed.

It means you can’t trust any valuation. I could have valued a subprime CDO better on May 6 than any equity. And it’s almost the same thing all day long. Valuations and prices have been divorced for a while. Just look at the volatility. It’s not like traditional trading. No wonder there are such increased correlations.

What this has to do with mobile computing?  Interestingly, I find that Apple is not just a victim of this de-coupling of fundamentals from valuation. I hold out hope that the stark facts of its performance might actually pop this correlation bubble.
The hope comes from the fact that trading strategies have finite lives.  As soon as a strategy develops to a point of being widely used, it makes sense for a contrarian to “short” or bet on the reverse of that trend, taking advantage of the tendency to overshoot. I don’t have a strong handle on this phenomenon, but the chances are that value/fundamental investment will be back with a vengeance and Apple might just be the leader, by sheer weight of numbers.

Apple's Cash Update

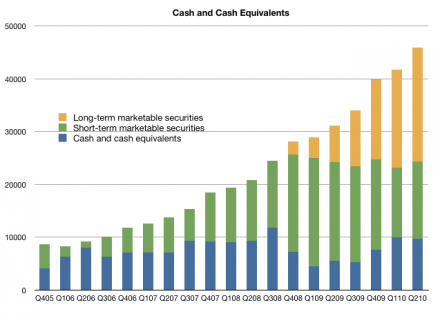
During the last quarter, the company added $4.1 billion in cash to reach a total of $45.839 billion or $49.43 per fully diluted share.  This is divided into three types of holdings (long- and short-term marketable securities and cash equivalents).

Some (most?) financial reporting services do not include long-term marketable securities in their databases. This is a tragic error which mis-states most of the balance sheet ratios that investors may depend on. Offending sources include Capital IQ (which feeds finance.yahoo.com.)

To illustrate, the following chart shows the total cash equivalents for the company.  The orange colored bars represent long-term securities.  If they are excluded, an investor may conclude that Apple’s cash has been *declining* since 2008 when the opposite is true. The company is shifting an increasingly larger proportion of its holdings to long-term (but fully liquid) securities.

The company devotes 9 pages in its 10-Q to describe and value the cash positions it holds.  It’s a pity that most aggregators of the company data don’t bother to note $21 billion in assets.

Estimating Fourth Quarter Earnings for Apple

We expect revenue to be about $18 billion compared to $12.2 billion in the September quarter last year. We expect gross margins to be about 35%…

We are targeting EPS of about $3.44.

via Apple Inc. AAPL Q3 2010 Earnings Call Transcript.

That $18 billion figure is extraordinary.  Consider that last year during the same quarter, the company received $12.2 billion, then the sales growth forecast is about 50%.  Granted that even though Apple just achieved 61% sales growth last quarter, Apple management is unusually aggressive in underestimating.

Given this, I am looking at the following forecast:

  • iPhone units: 12.2 million (65% growth)
  • Macs: 4 million (30% growth)
  • iPads: 3.3 million (flat sequentially, production constrained)
  • iPods: 9.4 million (-8% growth)
  • Music growth: 26.7%
  • Peripherals growth: 21%
  • Software growth: 8%
  • Total sales: $19.0 billion (56% y/y growth)
  • GM: 42.3%
  • EPS: $4.78 (73% y/y growth)

If this estimate proves correct, then at the end of the quarter (Oct 1) the trailing twelve months’ earnings per share will be $15.29.  That is equivalent to P/E of 16.82 on the back of four quarters of earnings growth (47%, 86%, 75% and 73% respectively).  The price/earnings excluding cash would be 13.4.

3Q review: The iPod revenues increase again

The iPod touch increased sales 48% year-over-year.  The continuing mix shift toward iPod touch resulted in an overall iPod ASP increase of 12% to $164 (up from $143) generating total iPod revenue growth of 4%.

Units declined 7.9%, inline with my expectations of -8%. I had forecast 9.40 and the actuals was 9.406 million. I note that most amateur analysts over-estimated iPods with my guess being the second lowest.  It’s important to consider just how much the iPhone (and iPad) cannibalize the non-iOS iPods.

I am estimating gross margin holding steady at 28%.

Looking forward I am forecasting ASP of 170 and unit growth of -8%.

I’ll also mention here the Music business.  Revenues grew at an accelerating 26.7%. This growth is a significant rebound from the 15% to 22% growth of 2009 though lower than the 30%+ range of 2007 and 2008.

3Q review: The iPad adds over $700 million of operating profit with an average selling price of $662

The iPad units numbers were not a surprise (except perhaps to some of the professional analysts who do not read Apple’s press releases). Among the more accurate (amateur) analysts, the range was from 3.2 to 3.45 million with an average of 3.32.  My estimate of 3.3 million was the mode of the distribution.

Apple sold 3.270 million in the first ever quarter.  The ASP came in at $662.39, below my expected $700 but higher than the iPhone.

The only unknown is the gross margin.  Given the overall GM and the other products’ margins, I am backing out a 33% margin for the quarter.  I had expected 40% but the lower margin may be a result of launch quarter issues (shipping and allocation of stock) and perhaps a lower target margin for the product.  It should be noted that the iPad margin sits between the Mac and iPod (around 30%) and the iPhone (around 60%).  The iPad is a new category that sits between the Mac and iPhone in terms of usage and it seems it sits also half-way in terms of margins.  Going forward, I’m still modeling a 40% GM for the iPad.

Overall, I estimate the iPad added $717 million of operating profit to Apple’s bottom line. Not bad for a product that was almost universally panned on launch day.

3Q review: Mac units grow 33%

Apple Reports Third Quarter Results.

I was surprised by the poor predictions of Mac units by the analyst community with estimates ranging from 2.86 million to 3.51.  It was fairly clear to me early in the quarter that the product would get 30%+ growth.  There was little news except overall Mac momentum to shape the forecast and it seemed logical that the growth would stay inline with the last quarter which was 32.8%. I dialed in 33% after the first month and stuck with this so my forecast came out to 3.46 million.

In the event, 3.472 million were sold for a growth of 33.4%.  The ASP came in at $1,267, slightly down from $1,278 last quarter and $1,289 the year before. ASPs are eroding but Apple are holding the rate down with product updates. Looking forward, I’m forecast $1,300 ASP.

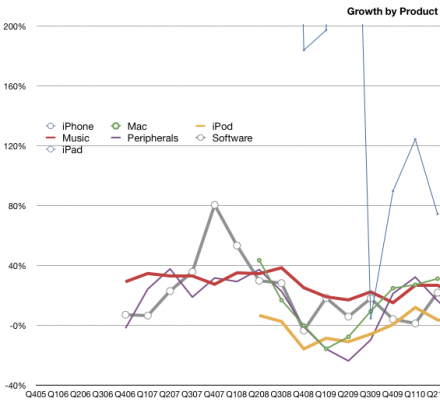
I estimate gross margin for the Mac at 27%. This is down from 31% a year ago. Revenue growth year-on-year was 31%.  The Mac  franchise is still doing better than most PC vendors and is gaining share. The graph below shows the growth by product revenues.  The Mac is now the second fastest grower after the iPhone (the iPad is not included yet as these are y/y growth rates.)

3Q review: iPhone revenues grow 74%

Calling the iPhone this quarter was going to be a challenge. This was a transition quarter where an old lead model would be replaced with a new one. The launch of the iPhone 4 was going to affect the volumes, but nobody could predict how. We’ve had a few such quarters and they were volatile. The number of sales days varied and the distribution of the old product was much different. The problem was compounded by the leak of the prototype and the uncertainties of launch day logistics. My forecast had been 8.5 million units.

In the event, 8,398,000 iPhones were sold. This included 1.7 million iPhone 4s which means about 6.7 million 3GS phones sold. That’s quite remarkable given the end-of-cycle timing.  8.7 million 3GS were sold in Q2 which means the sell-in was down only about 2 million for the transition.

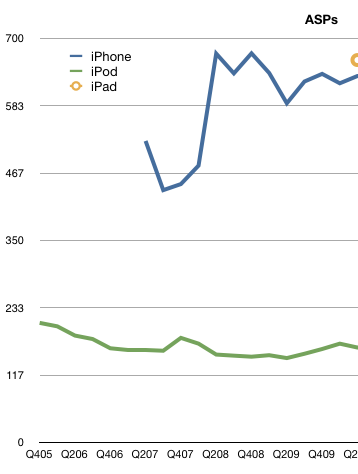
The even more remarkable story is the average selling price. It came in at $635.15. The iPhone has ranged from $437 to $674 ASP over the last three years (see chart). This figure places it near the top of the range, a great performance for the end of a product cycle quarter.

I estimate gross margin at 56%, a drop from the more typical 60% due to iPhone 4 launch. With revenues of $5.33 billion and cost of sales of $2.2 billion, Apple created operating profit of $3.13 billion–we’ll take a look at that number relative to other vendors later.

Growth year-on-year were 74% for revenues and 61% on units. For a transition quarter, these numbers are spectacular. For comparison, during 2009’s transition quarter (Q4) revenues grew at 5% and units 7%. Furthermore, according to Apple’s management, iPhone unit sales in the June quarter were running 90% above the year-ago period prior to the company draining thechannel ahead of the iPhone 4’s release. In the December and March quarters, unit sales were 100% or more above prior-year results. This means that 100% growth is sustainable though going forward I’m keeping forecast at 65% growth.

Seventy percent revenue growth cannot be seen as anything other than a sign of rude health.

LG joins Nokia in missing estimates due to competitive pressures

Losses from mobile phones totaled 120 billion won ($101 million) in the second quarter, compared with profit of 620 billion won a year earlier, Seoul-based LG said in a statement today. The loss, the division’s first in four years, was triple the size projected by the average estimate of five analysts surveyed by Bloomberg.

via LG Posts Record Handset Loss on IPhone, Smartphones – BusinessWeek.

Preference of next device by current smartphone owners

MacDailyNews – Yankee Groups Howe sets the record straight on Apple iPhone and Android devices.

• No other manufacturer can claim nearly the loyalty of iPhone owners. RIM BlackBerry owners see a touch-screen device as the antithesis of their hard keyboards. However, even in this category, 23 percent of respondents plan to buy an Apple iPhone. We see similar results with all other mobile phone owners. In fact, 36 percent of Google-branded Android phone owners say they plan to buy an iPhone, surpassing the 32 percent of Google-branded phone owners who intend to buy another Android phone.

Accuracy of Sales and Earnings Estimate

Earnings Smackdown: The best and worst Apple analysts – Apple 2.0 – Fortune Tech.

From the data above, it’s clear that although my accuracy on units and sales was pretty good, my EPS was too high. The reason for this was the lower margins for the iPad. It’s very likely that these margins will improve after the launch quarter (as they did for the iPhone).