Tim Cook on iPad vs. Netbooks: "It is sort of 100 to zero"

In terms of the iPad competing for customers who are considering a netbook, you know I am the wrong person to ask that. To me it is a no-brainer. iPad/Netbook, it is sort of 100 to zero. I can’t think of a single thing the netbook does well. iPad does so many things very, very well. I am already personally addicted to mine and couldn’t live without it.

via Apple Inc. F2Q10 (Qtr end 03/27/10) Earnings Call Transcript — Seeking Alpha.

Tim Cook on Apple TV: 34% growth but tiny addressable market

The units were up for the quarter 34% year-over-year but the absolute number of units are still small and we still classify the product as a hobby for the company. I would just repeat what I have probably said before. If you look at the other markets that Apple is in, the Macintosh competes in a market of 300 million or so units a year. The iPhone competes in a market if you look at all phones of maybe 1.2 billion a year. The iPod competes in a market that has 100 million plus or minus units per year.

So these are enormous sized markets and clearly the market that AppleTV is in is not in our view nearly that large as yet. That is the reason we classify it as a hobby so that no one gets the wrong impression that we have a vision that it is anywhere close to the size of the other businesses. However, a number of us love the product, use the product and we continue to think there is something is something interesting there and we continue to invest in it.

via Apple Inc. F2Q10 (Qtr end 03/27/10) Earnings Call Transcript — Seeking Alpha.

Tim Cook on iPhone Distribution: eight new carriers, three remain exclusive, total of 151

You can look at the number of carriers we added which was eight as I had mentioned, and out of the 151 carriers at the country level it is a good number but not a significant number. Obviously the existing carriers performed very well in addition to the adds.

… There are three main countries where iPhones have a contractual exclusive relationship. That is the United States, Germany and Spain. There are a few smaller countries where we have an exclusive or co-exclusive but those three are the ones that are the major markets. Over the past year we have moved a number of markets from exclusive to non-exclusive. In each case as we have done that we have seen our unit growth accelerate and our market share improve. But that doesn’t mean we view that formula works in every single case. I would just sort of reiterate what I did last time that this is how we are learning so far. That is the result we have seen so far. We think very carefully about each of these at the country level to conclude what is in our best interest.

via Apple Inc. F2Q10 (Qtr end 03/27/10) Earnings Call Transcript — Seeking Alpha.

Tim Cook on iPhone in China: 900% growth

China has been interesting. If you look at greater China which we define as mainland China, Hong Kong and Taiwan, the iPhone units were up year-over-year over 9 times. We added another 800 points of distribution in China. The revenue, we have never released this number before but I will do this in this particular case, through the first half of the fiscal year that we just completed for the six month period our revenue from greater China was almost $1.3 billion and this is up over 200% year-over-year. So we are well pleased with how the company is positioned to take advantage of the growth in greater China.

via Apple Inc. F2Q10 (Qtr end 03/27/10) Earnings Call Transcript — Seeking Alpha.

Peter Oppenheimer, CFO added:

We are very excited about China not only for retail but for Apple. Tim talked about the success we have had in greater China to date with revenue being up about two time’s year-over-year. With regard to retail stores we will open two stores in Shanghai this summer and with targets of having about 25 stores open in China by the end of calendar 2011.

As a point of reference, the Mac business growth in Asia is also pretty impressive: Mac units in APAC grew 67% vs. 20% in the Americas, 18% in Japan and 37% in Europe.

Apple Business Review: Cash Growth

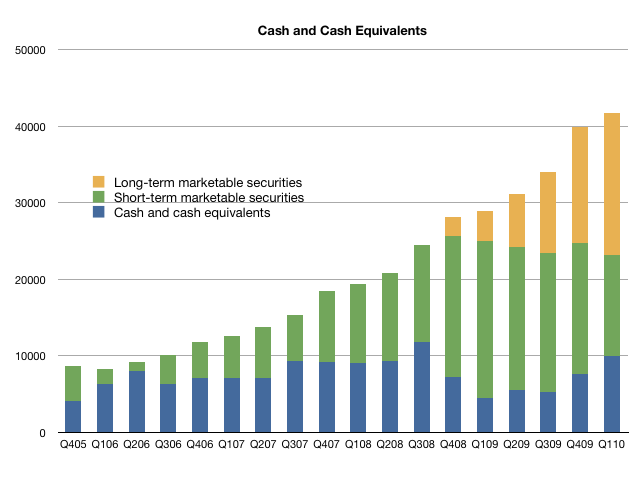
Apple’s cash continues to grow.  This quarter it reached $41.7 billion, a sequential increase of $1.9 billion.  This time last year, the cash was about $29 billion with a y/y increase of nearly $13 billion.  This is equivalent to $45.19 per share.

Many financial sites  report this figure incorrectly (e.g Yahoo finance with $24.8 billion) and are often cited by journalists.  This error is because Apple holds much of its cash in “Long-term marketable securities” and some choose to report only “short-term” holdings as cash.  Apple’s “Long-term” securities are the same as their “short-term” securities, namely US Treasury bonds.  The distinction is in the maturation date, not their liquidity.  Apple makes a clear statement of their cash position every quarter and highlights the composition of their holdings.

Note that more than one third of cash is currently in Long-term securities and exclusion of that item would indicate a decrease in Apple’s cash.

Note also that cash grows in a seasonal pattern. Q1 is typically the lowest growth, and Q4 the fastest.

The graph below shows Apple’s cash by security.

Apple Business Review: Product Line Margins

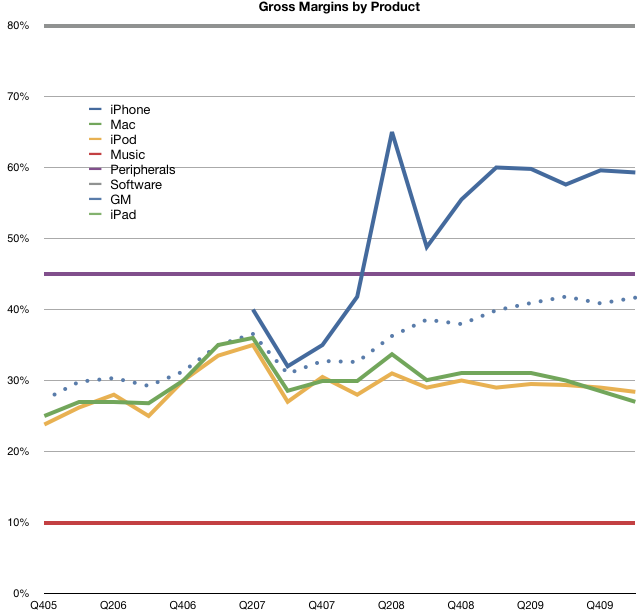
Apple’s overall gross margin reached 41.67%, the second highest ever.  The highest was 41.82% last Fall.  This should not come as a surprise as the iPhone continues to make up an increasingly larger percent of Apple’s total sales.  The gross margin on the iPhone continues to be well above all its other product lines (except for software).

Although Apple does not provide product line GM break-out, some intelligent guessing can be made.  Here are my estimates:

  • iPhone 59%
  • Mac 27%
  • iPod 28%
  • iTunes 10%
  • Periph 45%
  • Software 80%

A historic perspective for gross growth (iTunes, Peripheral and Software sales growth) is shown in the graph below.

Apple Business Review: Product Line Growth

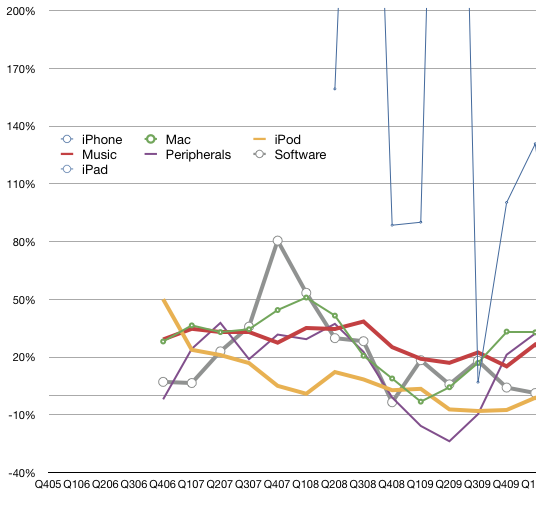
Each of Apple’s individual business lines is profitable.  Last quarter only the iPod experienced negative year-on-year unit growth but still generated a positive sales growth due to higher ASP.

Here is the list of each product line and its y/y sales growth:

Unit Growth, Sales Growth

  • iPhone 131%, 124%
  • Mac 33%, 27%
  • iPod -1%, 12%
  • iTunes n/a, 27%
  • Periph n/a, 32%
  • Software n/a, 1%

Overall sales grew 49%.

A historic perspective for unit growth (iTunes, Peripheral and Software sales growth) is shown in the graph below.

Nokia vs. Apple phones business comparison shows comfortable lead for Apple

Nokia reported 21.5 million converged devices sold in Q1.  The units, share, ASP, Revenues and Operating Profits are compared in the following table.

It’s once again evident that Apple captured more profits from the iPhone than Nokia did from all its devices and services operations.

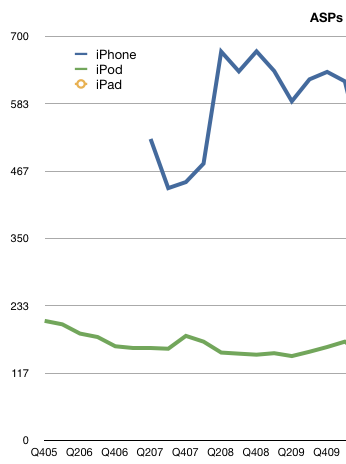
With respect to converged devices, Apple also generated more sales and had nearly triple the ASP.  Unit shares remained almost the same sequentially. Nokia did suffer more from ASP erosion sequentially as the converged ASP dropped by 24% vs. a 2.5% drop for Apple.

What is interesting from a growth perspective is that Apple’s #1 position in the share of profits from mobile phones was acquired with such a low market share.  Analyst Brian Marshall said the most interesting part of Apple’s story is the international growth of the iPhone. He believes that Apple has only acquired about 1.5 percent of its international carrier partners’ total postpaid subscription base of 525 million. For comparison, its penetration in the U.S. peaked in Sept. 2009 on AT&T with 5 percent.

Sources:

Nokia – Investors- News Release

Apple – Investor Relations