Lasts Longer

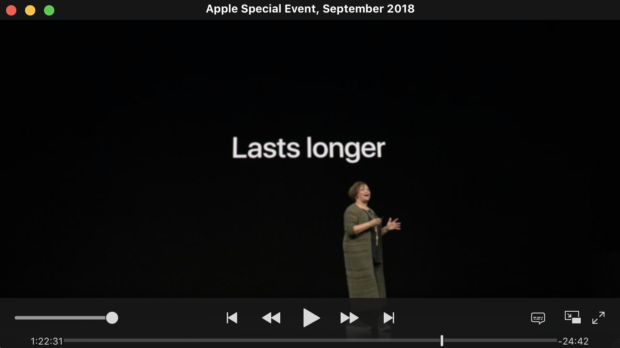
I think Lisa Jackson’s presentation at the September 2018 iPhone launch event was perhaps the most interesting and most profound.

Lisa Jackson is Apple’s vice president of Environment, Policy and Social Initiatives. Previously, Ms. Jackson served as Administrator of the U.S. Environmental Protection Agency (EPA). In her role at Apple she has been responsible for the transition to 100% renewable energy use by Apple across all its facilities.

This goal has been achieved and it’s a remarkable achievement deserving congratulations. But her presentation was noteworthy for setting a new goal.

She laid out a goal for Apple to eliminate the need to mine new materials from the Earth.

She said that to reach that goal Apple will have to do three things:

  1. Sourcing recycled or renewable materials for all products.
  2. Ensure that Apple products last as long as possible.
  3. After a long life of use, ensure that they are recycled properly.

It’s this second point that I thought would bring the house down.

To emphasize the second point she said Apple now strives to design and build durable products that last as long as possible. That means long-lasting hardware coupled with long-lasting software. She pointed out that iOS 12 runs even on iPhone 5S, now five years old. Because iPhones last longer, you can keep using them or pass them on to someone who will continue to use them after you upgrade.

She said that “keeping iPhones in use” is the best thing for the planet.

At this point in the presentation I wondered if everyone would rush out of the room and call their broker to sell Apple shares. One premise of investing in durable goods hardware companies is that value depends on frequency of upgrades. If products are not replaced frequently they do not generate revenues and the company selling them ends up growing very slowly if at all after markets saturate. The smartphone business is certainly approaching saturation and the implication of making Apple products more durable would imply lower revenues from replacements. This anxiety around replacement rates and extended lives is used by analysts to discount future cash flows and if those lifespans are extended price targets come down.

So why would Apple want to do this?  What is the logic of this durability focus as a business model? It may be good for the environment but is it good for the bottom line?

Of course, there would be not much business without an environment and we should all strive for sustainability.  But this is an existential observation, and it’s defensive. The important call to make is that Apple is making a bet that sustainability is a growth business.

Fundamentally, Apple is betting on having customers not selling them products.

The purpose of Apple as a firm is to create and preserve customers and to create and preserve products. This is fundamental and not fully recognized.

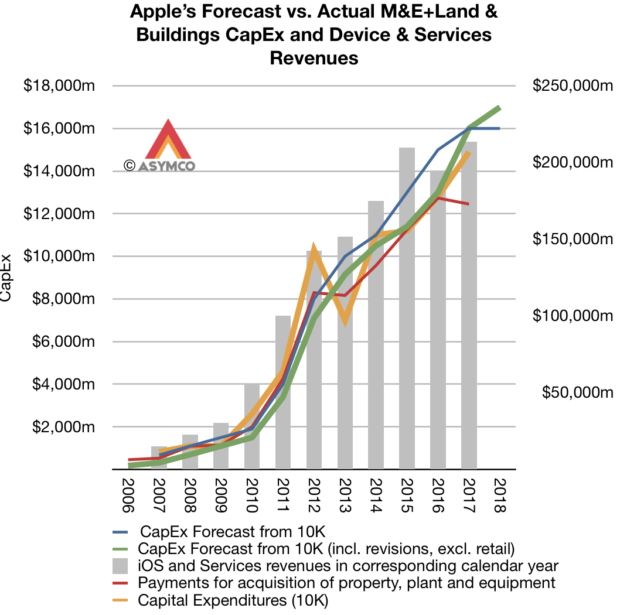
To understand how this works, if you look at the pricing graph below, you can read it as a story of increasing prices for a decreasing market share. But if you understand that each advance in products increases absorbable1 utility then the cost per use remains steady or declines.

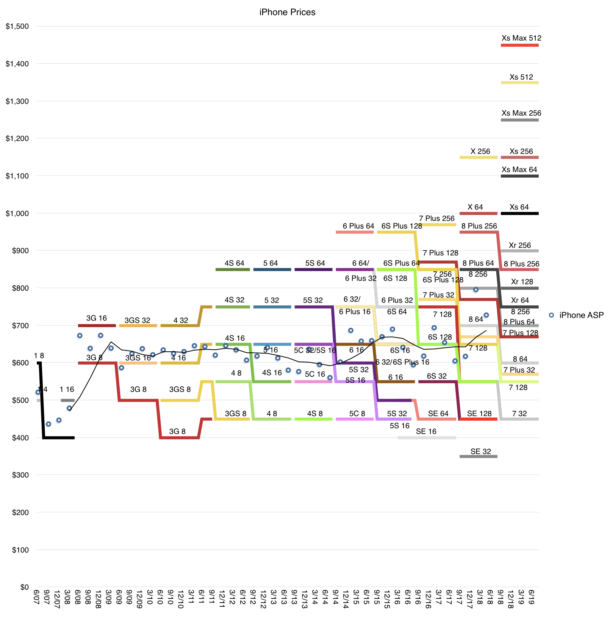
An iPhone at $1200 may be less expensive than an iPhone at $600 if the $1200 version lasts twice as long as is used twice as much each day. The $1200 phone delivers 4x the utility at twice the price, making it half the price. By making more durable products, both in terms of hardware and software, the customer base is satisfied and preserved.

Practically, the initial buyer may resell the iPhone and that 2nd hand devices may be sold yet again. This means an iPhone could have three users over its life and thus it could end up expanding the audience for Apple by a factor of 2 or even 3.

The expanded audience is offered accessories, additional products such as wearables and, of course, services. These residual business models are certainly profitable, perhaps even more so than the iPhone.

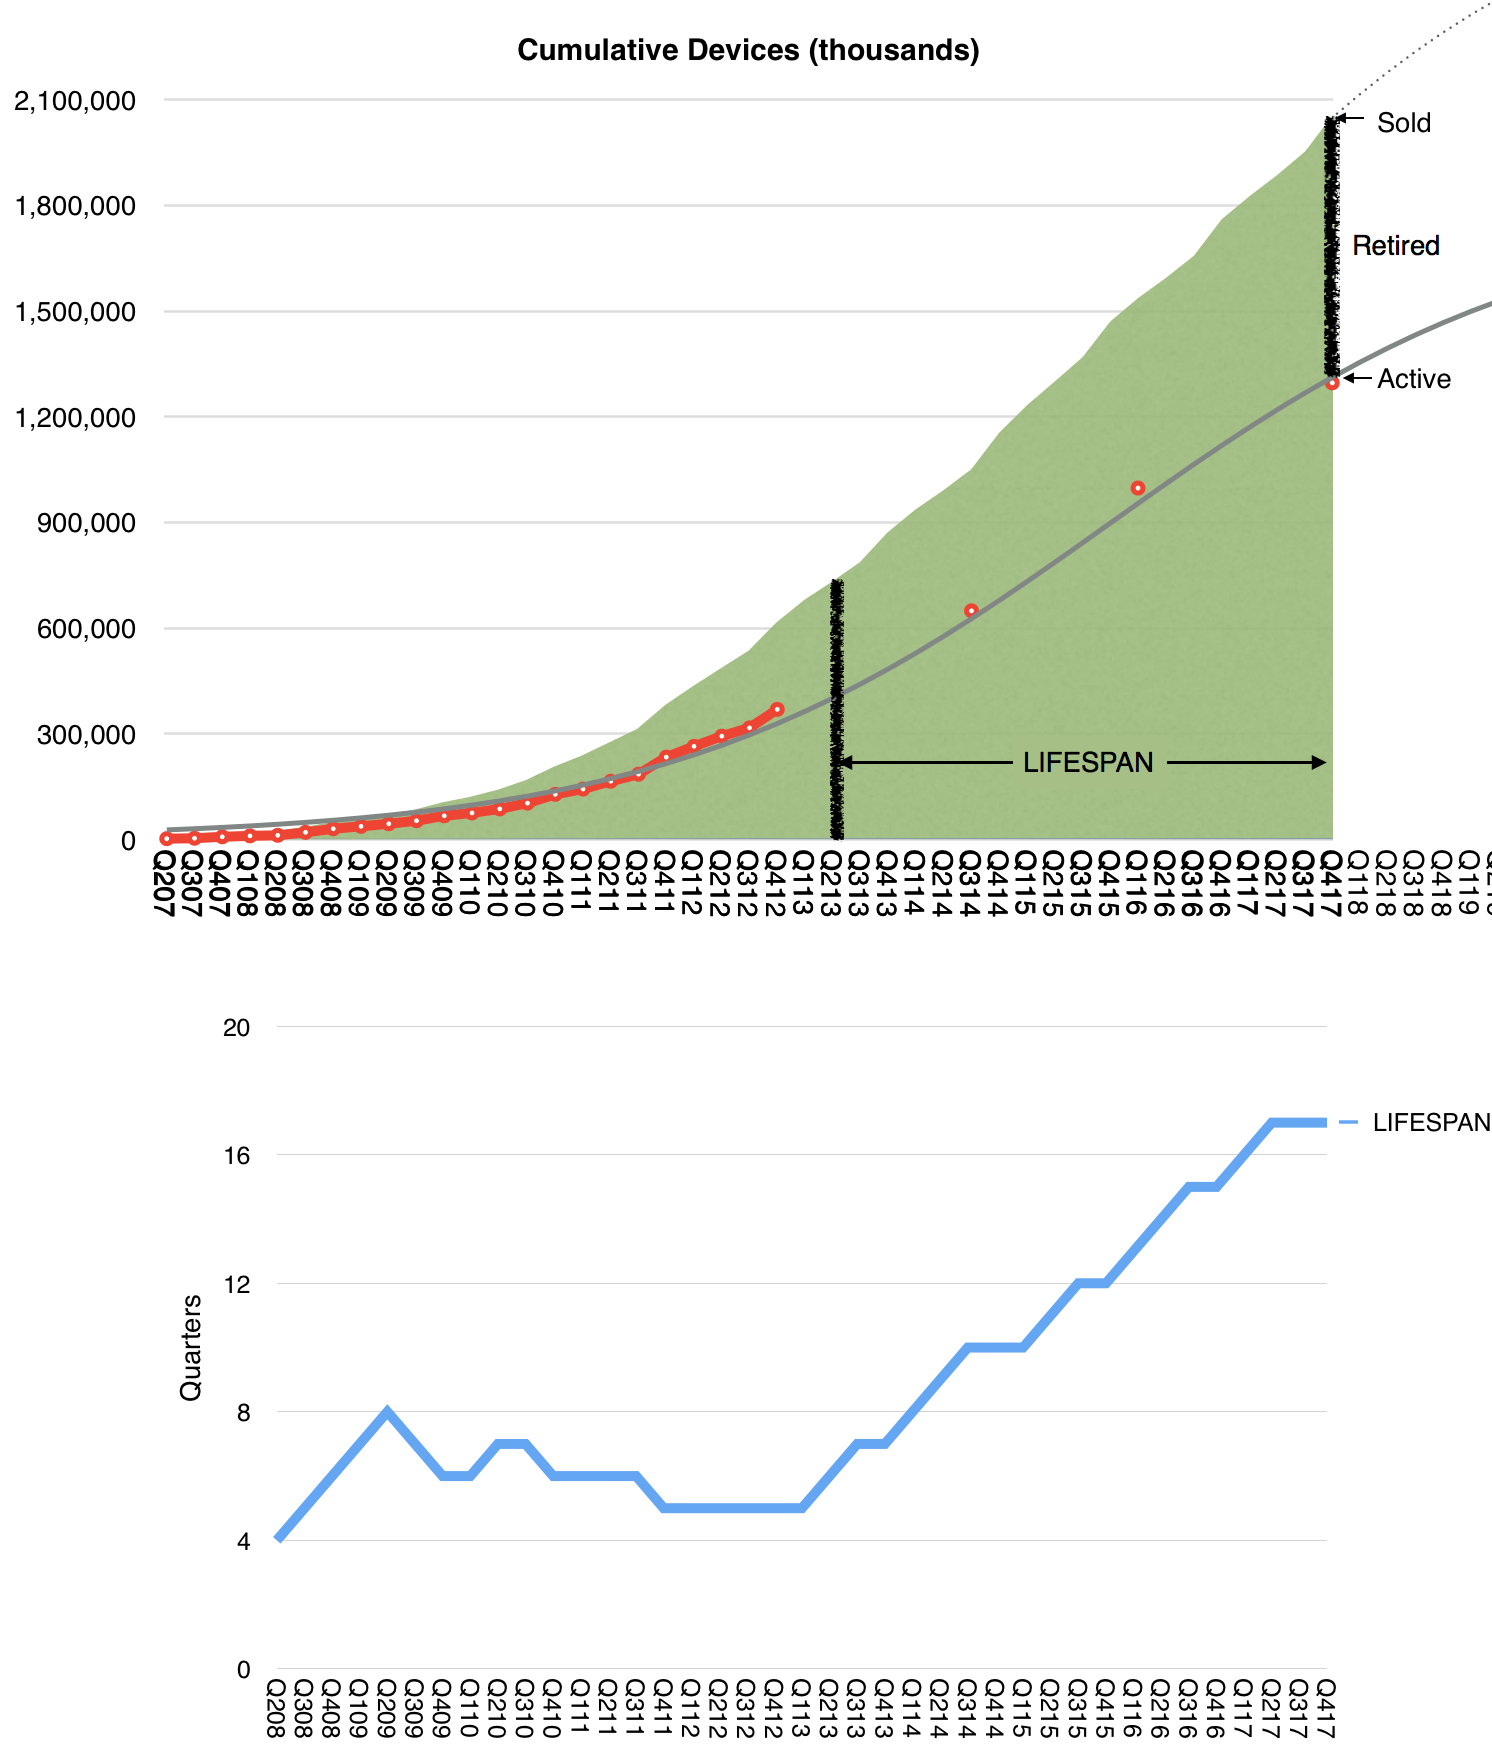
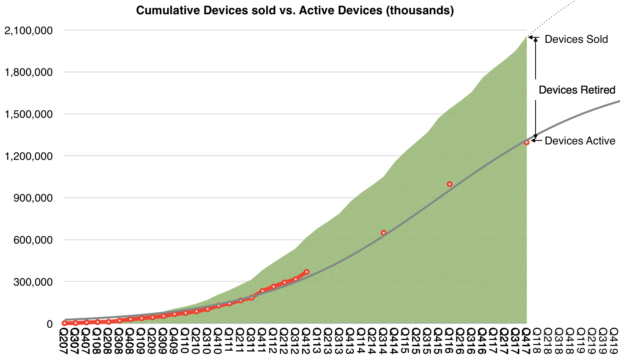
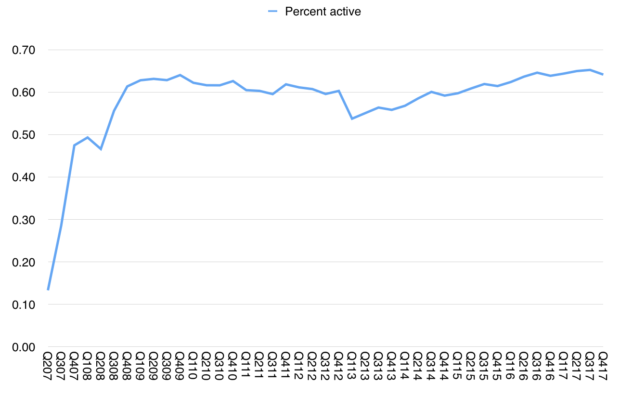
Overall Apple has 1.3 billion devices in use and perhaps as many as 1 billion users. This base is certain to expand and it will expand more rapidly with durable devices and software.

This is a hardware-as-platform and hardware-as-subscription model that no other hardware company can match. It is not only highly responsible but it’s highly defensible and therefore a great business. Planned obsolescence is a bad business and is not defensible.

Therefore the statement that Apple now prioritizes device and software longevity is very important and I consider it one of the most important statements made during the 2018 iPhone launch event.

  1. Insoluble  utility is very dangerous and it’s important to qualify e.g. higher storage capacity that people hunger for or better cameras that increase picture taking from features that are neat but don’t get utilized []

Preview of the holiday quarter

Every October, at the end of its fiscal year, Apple files its Form 10K or annual report. In this report the company includes a section titled “Capital Assets” which details expenditures for capital equipment. This is last year’s entry:

The Company’s capital expenditures were $14.9 billion during 2017. The Company anticipates utilizing approximately $16.0 billion for capital expenditures during 2018, which includes product tooling and manufacturing process equipment; data centers; corporate facilities and infrastructure, including information systems hardware, software and enhancements; and retail store facilities.

Note that there are categories of spending detailed and that their order might indicate the degree of such spending, suggesting that product tooling and manufacturing equipment is likely to be the costliest category.

After this report, during subsequent quarters the company may update this forecast of spending. In the last (third fiscal) quarter the entry was as follows:

The Company’s capital expenditures were $11.1 billion during the first nine months of 2018 . The Company anticipates utilizing approximately $17.0 billion for capital expenditures during 2018, which includes product tooling and manufacturing process equipment; data centers; corporate facilities and infrastructure, including information systems hardware, software and enhancements; and retail store facilities.

Note that the forecast of $16.0 billion was updated to $17.0 billion and the first 9 months’ expenditures were $11.1. Since there is only one quarter remaining1 it’s reasonable to assume that the company’s forecasts are more likely to be precise and that therefore the difference between total expected spending and already spent, i.e.f $5.9 billion remains to be spent.

The actual spending is not recorded quarterly but an approximate value is reported in the Cash Flow statement as “Payments for acquisition of property, plant and equipment”. That can be tracked but it does not equal exactly the capital expenditure. For example, the quote above says expenditures were $11.1 billion through first 9 months but the total of all payments for acquisition of PP&E is $10.272 billion.

Minor2 differences, aside, this forecast and actual spending and payments data is significant because it is highly correlated to Apple’s overall business. Assuming that the spending on manufacturing equipment and information systems hardware (i.e. data centers) is in support of the iOS device sales and services we can try to show how sales correspond to spending with the following graph:

Here sales are shown as a bar graph and the various spending forecasts and actual payments are shown as lines. Also note that the spending and sales are offset by one quarter. The fiscal year is used for spending and the calendar year for sales. The reason is that spending is presumed to lead sales by approximately one quarter.

There are some notable discrepancies, especially with the 2012/2013 period when spending was brought forward a quarter thus showing a surplus to forecast in 2012 and a deficit in 2013. But apart from that, there is a broad correlation between spending and sales.

This means that the CapEx forecast in October is a good indicator of sales in the following year.

In fact, the relationship is can be shown with four scatter plots, one for each of the published figure:

I caution that this is a yearly forecast and it is revised through the year on a quarterly basis, sometimes up, sometimes down. It’s therefore not a perfect indicator and of course the relationship between sales and spending is not perfectly predictable. Note that there are four types of spending that can be measured, two are forecasts (one year and revised) and two are actuals (cash flow payments and reported total expenditures)

We can measure the best variable that fits the sales data through the coefficient of determination or R-squared. The best fit seems to be with Payments for acquisition of property, plant and equipment (R-squared of 0.976).

This gives the formula for yearly sales as 15.915x + 15809 where x is the expected total spending. That spending to date has been $10.272 billion and it’s probably going to exceed $16 billion for the year.

Using $16 billion spending total, we can calculate iOS products and services for calendar 2018 of $270.45 billion.

iOS and Services sales to date have been $103.2 billion with an estimate for next quarter of about 54.3 billion (based on guidance) and thus a total through Q3 of $157.5 billion. Subtracting this from the $270.45 billion expectation from the calculation above gives a fourth calendar quarter iOS revenue of $113 billion.

Adding $7 billion for the Mac results in a total net sales of 120billion. This therefore is what I’d put forward as a reasonable target for CQ4.

Note that this is equivalent to a growth of 36% from the 2017 fourth quarter.

[UPDATE: Original version used total sales rather than iOS related products and services (i.e. excluding Mac). The text has been edited to reflect the correct figures.]

  1. and since at the time the quarterly report is filed, only about 2 months remain in the quarter []
  2. To the extent that $1 billion can be considered minor []

Micromobility Summit 2018 September 5, Copenhagen

Last year’s Micromobility Summit was a great success. We had a great turnout and the presenters and audience met to discuss the future of this new modal shift that seemed so imminent.

Perhaps partly because of our meeting, the shift has since accelerated. The amount of capital allocated, firms participating and usage have all exploded. In one year micromobility went from a curious hobby to the biggest startup story in the world now attracting mainstream attention.

Bird, Lime, Skip have pioneered scooter sharing. Smide in Switzerland is offering e-bike sharing and Uber, Lyft and Didi made acquisitions. More OEMs and Tier 1 suppliers are betting on this sector and we have hundreds of new e-bike models entering the European market and literally billions of vehicle miles traveled using micromobility. 400 million users are registered in China alone with 70 million daily active.

Micromobility Summit 2017 was the catalyst of several startups that operate in the space today. It was great opportunity for like-minded entrepreneurs to discuss this market.

It’s time then to follow-up with the second Micromobility Summit. Coming almost exactly a year after the first, we will conduct a similar approach: speakers and panels covering the following topics:

  • Micromobility definition and categorization
  • Micromobility competitiveness relative to incumbents
  • Micromobility business models and asymmetry to macromobility
  • Regulation and evolution of normative behaviors

I will present research currently under peer review on the competitiveness of new modalities relative to existing and their conversion potential. Titled “When Micromobility Attacks”, it’s an adaptation of a paper just submitted to a peer-reviewed journal (written with ETH Zurich)

If you would be interested in attending or speaking let me know through the sign-up sheet at the event web page.

Apple Summit NYC

We are proud to announce the second investor summit dedicated to the long-term investors in Apple. It’s happening in New York City at The Merceron August 16th from 10am to 10pm.

We will host people interested in discussing the fundamentals of Apple as a business and how it operates as a recurring revenue model.

Titled “The Goose That Lays The Golden Eggs” it was inspired by a blog post from 2013 foreshadowing how human nature instinctively discounts Apple and yet how that nature is mismatched to how Apple actually works.

If you are curious about why Wall Street says “Sell” and Warren Buffet says “Buy” on Apple you might want to spend some time with us.

Agenda:

  • How to read the company’s performance given its published results. We will review how to build a model of the company’s financials and how it can be used to forecast the next quarter. We can go line-by-line through the income statement.
  • How to think about the markets Apple considers important. This is the best way to forecast the company’s performance beyond its current portfolio. This requires calibrating your sense of timing of innovations. What is too early, what is too small, what is something where Apple can’t exercise control? Innovation theory is essential to this understanding. If you know where Apple could go next and where it won’t it helps you build patience into your planning.
  • How to understand Apple’s culture and its resources and processes. This gets into the critical management question that leadership at Apple is concerned with. I’ve had a few conversations with and have some great insight from former managers. Curiously, this is Apple’s greatest competitive advantage and its sustainability is the key “moat” question. Most people don’t even realize that this is the most important question for investors.
  • How to understand the market’s reaction to Apple. If you understand the three points above it becomes necessary to juxtapose how others see the company. There is a compelling case of asymmetry of information even though “everyone” is watching the same data. I use the fable of “The Goose that Lays the Golden Eggs” to best describe how most people react when they observe Apple. Apple is something which cannot possibly exist and therefore it is fragile and must be treated as a transient system. It leads to deep discounting in the market. This cognitive illusion has an opposite: monopolies are over-valued because they are seen as invulnerable and permanent even though they are brittle. I use antifragility as another metaphor. Many anecdotes from Steve Jobs also indicate that he understood this asymmetry and instilled it in the company. Investors need to understand this dynamic in order to profit from it.

Sign up here.

Earnings Per Share

Three months ago Apple provided the following guidance:

As we move ahead into the June quarter,[…] We expect revenue to be between $51.5 billion and $53.5 billion. We expect gross margin to be between 38% and 38.5%. We expect OpEx to be between $7.7 billion and $7.8 billion. We expect OI&E to be about $400 million. And we expect our tax rate to be about 14.5%.

If we aim for a revenue figure close to the upper end of the range ($53.2 billion) and insert all the other figures (split the difference for OpEx) then then the company’s fiscal third quarter looks as follows:

Revenues: $53.2b
iPhone (units): 43.2 million
iPad (units): 11.6 million
Mac (units): 4.3 million
Services ($): 9.5 billion
Other products ($): 3.5 billion
Gross margin (%): 38.6%

EPS ($): $2.26

This last figure, the earnings per share, is the most speculative because it depends on another guidance that Apple gave: a new $100 billion share repurchase authorization and the fact that it has no time frame. For context, as of end of March the company had completed over $275 billion of its previous $300 billion capital return program and $10 billion remained for share re-purchases in the June quarter. It’s unclear how much of the new authorization will be spent in the quarter.

That spending could indicate the share count but there are issues with this calculation as well. The $2.26 EPS I forecast is based on the assumption that the the same number of shares will be retired as in the previous quarter (about 89 million shares.) However the company spent $23.5 billion on repurchases of 137 million Apple shares through open market transactions (for an average price or $171.53, in-line with the quarter’s trading average).

So why is the number of shares purchased (137 million) so different from the change in shares used to compute earnings per share (89 million)? I actually don’t know.

The question of how many shares are available to calculating EPS is perhaps the last mystery in what is otherwise a very predictable business. The revenue growth and implied iPhone growth are pretty transparent. Incidentally, the EPS I’m forecasting is equivalent to growth of 35.8% y/y. The share price is trading at multiples about half of this growth rate so it’s no wonder the company is spending most of the cash on re-purchases.

How quickly the $100 billion re-purchasing authorization will be used is another question. The effect in concentration of value per share could be profound as shown in the graph above which will have further implications on the “cash zero” direction for the company.


Asymcar 44: The view from Tokyo with Bertel Schmitt

Bertel Schmitt, industry propagandist, journalist and legend joins us for a rousing conversation on production, low-end cars, Tesla, and the Great ‘Round-the-globe Automotive Factory tour Tour.

One of the most fun shows I’ve ever recorded. Highly recommended.

Listen here.

On knowing the value of everything and the price of nothing

At the latest Apple Summit in Los Angeles the question of Apple’s valuation was foremost on many minds. The illustration I used there to discuss valuation is shown below.

It shows the history of revenues (by reported segments) and gross margin for the five largest companies in the world by market capitalization. I have been publishing this illustration for five years1 in order to contrast the growth and perception of value between companies that might be considered comparable with Apple. Thus the graphs show the top and (near) bottom lines of the companies over an epoch of about a decade.2

In contrast with the histories above, there is a price set on the equities today. These prices are captured by the market capitalizations as follows:

Current market cap (billion)  Peak market capitalization (Billion)
Apple

$918

$955

Amazon

$844

$856

Alphabet

$810

$825

Microsoft

$780

$789

Facebook

$584

$589


Market capitalizations are interesting because they show perceptions of value. The traders in the equity are negotiating with each other on what the shares are worth and, as a voting system in a liquid public asset, share pricing is very representative of the perceptions about that asset. Representative because there are literally millions of decisions being made on a daily basis which determine this price.

Continue reading “On knowing the value of everything and the price of nothing”

  1. initially with Samsung rather than Facebook because it was originally a set of “challengers” to Apple. The fact that with only one substitution the illustration turned into a view of the five largest companies in the world was a welcome surprise. []
  2. This being the iPhone epoch []

Apple Summit, Los Angeles

Technorati and I are proud to announce the first investor summit dedicated to the long-term investors in Apple.

We will host folks interested in discussing the fundamentals of Apple as a business and how it operates as a recurring revenue model.

Titled “The Goose That Lays The Golden Eggs” it was inspired by a blog post from 2013 foreshadowing how human nature instinctively discounts Apple and yet how that nature is mismatched to how Apple actually works.

If you are curious about why Wall Street says “Sell” and Warren Buffet says “Buy” on Apple you might want to spend some time with us.

Agenda:

  • How to read the company’s performance given its published results. We will review how to build a model of the company’s financials and how it can be used to forecast the next quarter. We can go line-by-line through the income statement.
  • How to think about the markets Apple considers important. This is the best way to forecast the company’s performance beyond its current portfolio. This requires calibrating your sense of timing of innovations. What is too early, what is too small, what is something where Apple can’t exercise control? Innovation theory is essential to this understanding. If you know where Apple could go next and where it won’t it helps you build patience into your planning.
  • How to understand Apple’s culture and its resources and processes. This gets into the critical management question that leadership at Apple is concerned with. I’ve had a few conversations with and have some great insight from former managers. Curiously, this is Apple’s greatest competitive advantage and its sustainability is the key “moat” question. Most people don’t even realize that this is the most important question for investors.
  • How to understand the market’s reaction to Apple. If you understand the three points above it becomes necessary to juxtapose how others see the company. There is a compelling case of asymmetry of information even though “everyone” is watching the same data. I use the fable of “The Goose that Lays the Golden Eggs” to best describe how most people react when they observe Apple. Apple is something which cannot possibly exist and therefore it is fragile and must be treated as a transient system. It leads to deep discounting in the market. This cognitive illusion has an opposite: monopolies are over-valued because they are seen as invulnerable and permanent even though they are brittle. I use antifragility as another metaphor. Many anecdotes from Steve Jobs also indicate that he understood this asymmetry and instilled it in the company. Investors need to understand this dynamic in order to profit from it.

Sign up here.

Apple Summit

Determining The Average Apple Device Lifespan

In The Number I provided a model for estimating the number of active Apple devices at any point in time. The relationship between active devices and cumulative devices sold gives us a rule of thumb that says that 2 out of 3 devices ever sold are active.

I propose now that knowing active devices and cumulative devices sold allows one to determine the average device lifespan.

The following graph is a visual representation of how to obtain it:

Note that the second graph shows how the lifespan evolved over time.

Here’s how to compute this yourself: Visually, the lifespan is the distance horizontally between the two vertical bars such that the bars are the same length. The top vertical bar measures the gap between the area (cumulative devices) and the curve (active devices) and the lower bar is the gap between the area and the x-axis, i.e. the cumulative devices. When those two bars are the same size the distance between them is the lifespan (at the time of the top bar.)

Arithmetically, the average lifespan at a given time t is the duration between t and the moment when the cumulative devices sold reached the cumulative retired devices at time t.1

For example today–as the visual above represents–the lifespan is the time since cumulative devices sold reached the current total retired devices. The cumulative retired devices can be calculated as 2.05 billion cumulative sold minus 1.3 billion active or 750 million. The time when cumulative devices sold reached 750 million was the third quarter 2013. The lifespan is thus estimated at the time between now and Q3 2013 or 17 quarters or about 4 years and three months.

Note that cumulative devices sold includes Macs, iPhones, iPads, Apple Watches and iPod touch. Since (apart from the Watch2 ) this information is public, the only figure needed to determine lifespan at any time is active devices and that total is available through the logistic fit described in The Number.

In The Number I argued that active devices is a breakthrough in quantifying the value of Apple’s business. The first insight is into the size of device (read: user)  base, the second is in the resilience of that device base (2/3 in use). Now we see the third insight: the specific length of time or duration of use per device–a proxy for user satisfaction and loyalty. This I (and Deming) argue, is the most important measure of the health of a business because it speaks of the future and not, as all other figures do, the past.

I’ll show in the next post how this single number allows us to calculate the net present value of Apple’s future cash flows, or, by definition, Apple’s enterprise value.

  1. For a simulation and tabular explanation see below []
  2. Which I calculate to a satisfactory precision here []

The Number

The first number that Tim Cook mentioned in the fourth quarter investor conference call was the number of active Apple devices. The 1.3 billion monthly active devices is the most important measure of the health of Apple’s business. It’s the primary way the company chooses to measure itself and it’s the best instrument available to understand the company’s strategy.

This is only the second time this number was revealed. The previous figure, given in January 2016, was 1 billion active devices. Thus, while Apple sold 586,744,000 devices1 the number of active devices increased by 300,000,000. While the number of units sold is frequently updated and attracts a lot of attention, the number of units active is very infrequently updated and attracts little attention. Yet the number of active devices speaks of the future of the company and should be carefully scrutinized while the number of devices sold speaks of the past and should be cursorily glanced at.

Dr. Edward Deming once said that the numbers that best define a company are two factors that do not appear on any financial statement. These factors are the value of a satisfied customer and the value of a dissatisfied customer. These factors must be multiplied by every other number in a financial statement in order to assess the prospects of the business. A high satisfaction leads to repeat purchases and referrals, growing the business; while a low satisfaction leads to ending relationships and a repulsion of potential new customers.

These numbers determine everything about the future and nobody quite knows what they are.

It’s tempting to suppose that, by asking, you can find out if customers are satisfied. Certainly the company cites these answers to the question of satisfaction and it’s partially useful to have some data. But customers are people and people are social beings. They are flawed in that they want to be liked and will use their powers of deduction to determine whether what they say will lead to their being liked more. Thus they will say things which they judge the listener will want to hear.

This auto-suggestion is especially likely when the answer (satisfaction) is so difficult to ascertain and the feeling is so fleeting.

You can’t rely on surveys alone to know if people like your product. You have to base that number on what they do.

This is where the active device data comes in.

A liked product will be used and a well-liked product will be used more. Usage is valuable not just in its intensity but also in its duration. When you see activity of a device it’s always a good sign if that is both frequent and long-lasting.

The following graph shows the history of cumulative devices sold by Apple since mid-2007, when the iPhone was launched. That total is now 2.05 billion devices. I have added early estimates on the number of active devices (in red) based on assumptions about product life-span. I added the company’s own reported figures since then.

I then tried to paint a continuous curve for this active number using a logistic function which assumes a diffusion into a population of addressable users, shown as the grey line above. The logistic curve is a good tool because it has a solid theoretical foundation in social behaviors.

The formula for this line is S÷(1+EXP(−1×(tog)) where S is the point of saturation or maximum population size, t is the period or count of quarters (1 for Q1 2007 and 2 for Q2 2007, etc), o is the offset to 50% or the point of inflection, in quarters, and g is the growth factor.

The S-curve above corresponds to S=1.8 billion, o=35 and g=8.

I chose these parameters because they best fit the data. It does not mean the reality will be precisely this but this is the best guess so far. It implies that there will be about 1.8 billion active devices sometime close to 2022 and tells us how we get there. This can and will change but for now this is the best guess using a theory that has worked in similar circumstances.

Working backwards from this active base estimate, we have predictive power on units sold, and even on revenues. However this is not the whole story. It’s not even the main story. What matters is what it tells us of the relationship between past behavior (purchases) and future behavior (use, referral, repeat purchase). This is hinted at by the ratio between purchases and active devices. In other words, the ratio between cumulative units and active units tells us whether the products are used and for how long. Having a continuous estimate of active uses allows for a reliable measure of satisfaction.

The following graph shows this estimate.

Note that the ratio remains remarkably constant. It’s currently about 64%. It’s so constant that perhaps we can invent a rule of thumb which says that two out of every three devices ever sold by Apple is still in use. And that this rule is always true.

This begins to be interesting.

The staying power and predictability of the business2 comes from a guarantee that activity is rigidly tied to purchase.

This speaks more than any satisfaction survey. It’s a measure of actions based on interaction rather than words based on human frailty.

There is no better number available to predict Apple’s business.

  1. This is an estimate that includes Macs, iPhones, iPads and Apple Watch but does not include Apple TV or accessories such as AirPods. []
  2. i.e. Free cash flow []