Estimating Apple’s Second Calendar Quarter

Apple reports second calendar quarter results in about a week. I propose the following estimates:

Fiscal Q3 2017:
Rev ($B) 45.321
EPS ($) 1.62
iPhone (units) 41 million
iPad (units) 9.8 million
Mac (units) 4.35 million
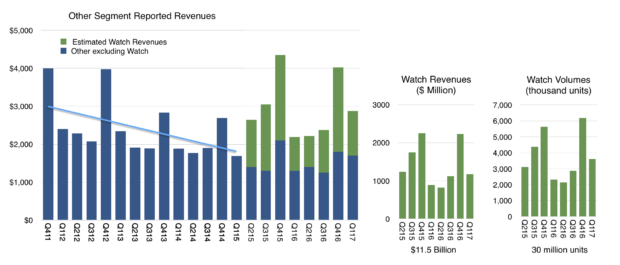
Watch (units) 2.5 million
Services ($) 7.2 billion
Other products ($) 2.6 billion
Gross margin (%) 38.4

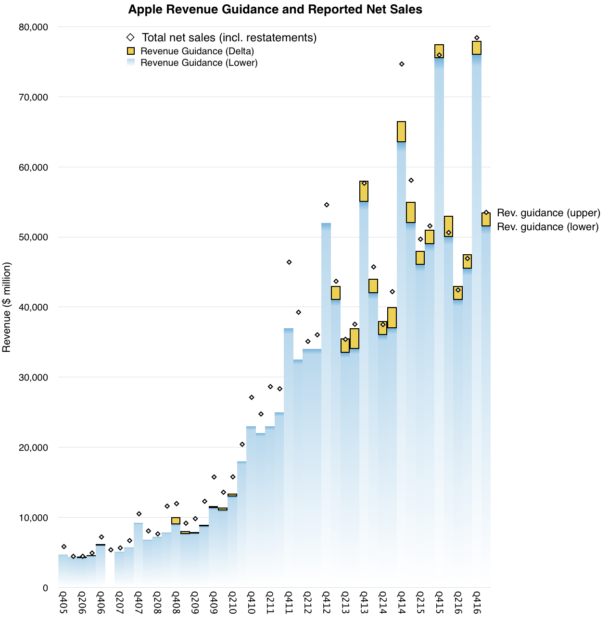
The revenue estimate is visualized in relation to guidance (revenue between $43.5 billion and $45.5 billion) and shown in the context of previous actual revenues below:p

The estimates are also consistent with additional guidance provided:

  • Gross margin between 37.5% and 38.5%
  • Operating expenses between $6.6 billion and $6.7 billion
  • Other income/(expense) of $450 million
  • Tax rate of 25.5%

The estimates (and guidance) suggest modest growth of 7% in revenues and 13.7% EPS. The predictability of the quarter suggests that attention will mostly be focused on guidance for the next quarter.

Expectations can vary quite a bit because of the effects of a new launch. The product mix, pricing and timing are all unknown at this time.

What is known however is that the customer base for Apple is increasing and loyalty is higher than ever. What I sense, coming from very few data points, is that there are more iPhones in use than ever before. A few years ago when the market was less saturated it was easy to assume that commodity Android phones and tablets would surge and swamp iPhone/iOS usage.

This has not happened, indeed the data suggests that iOS usage is stronger than ever and that there are many more “switchers” moving from Android to iOS than vice-versa.

This may surprise some but if we look at the PC market, a similar phenomenon has been taking place for years. Mac usage grows and Macs are more visible and valuable than PCs.

It’s important to note that in the latter, post saturation stages, the markets for both phones and computers are increasingly driven by brand value. This resistance to commoditization is due to buyers’ perceptions of quality moving beyond utility and of the prioritization by buyers of new measures of performance. These new measures defy measurement.

Much of what is therefore required of market analysts is intuition.

Other Products

From the way Apple reports its revenues you might think that the company has several operating segments. There are the iPhone, the Mac, the iPad for which units and revenues are reported. Then there are Services and Other Products for which we have revenues only.

Services is a collection of all non-hardware revenues and is (finally) being recognized as a non-trivial business. With reported revenues of $26.6 billion in the last twelve months, it’s big enough to be a Fortune 100 company and set to double in four years.1

That leaves “Other Products” which now becomes the revenue segment that is  “most likely to be ignored.” This segment had revenues of only about $11.5 billion in the last 12 months which would place it at only a Fortune 245 ranking, equivalent to a Toys “R” Us or Biogen. How should we value Other Products?

Other includes many hardware products including iPod, Apple TV, Beats, Apple Watch, AirPods and, soon, HomePod. Each is a significant product, with Watch probably the largest single contributor. But since we don’t have specific unit numbers, we are left guessing at the contribution of each.

The Watch itself has been a point of scrutiny as it could be initially teased out of the mix through an observation of the before-and-after launch vs. trend-line as shown below:

This separation of Watch became harder to discern after the launch of AirPods. Though they are still very hard to obtain, they might be “moving the needle” by now with a contribution that would muddy the Other category further. Same with updated Beats headphones.

Continue reading “Other Products”

  1. Although a non-zero business, the valuation of Services continues to confound observers who cannot separate it from the hardware businesses it attaches to–which themselves are considered near commodity value–thus paradoxically valuing the overlying asset of Services near or precisely at zero. Incidentally, Facebook is Fortune 98 at $27.3 billion and it is also one of the top 5 largest business by market capitalization. []

Join the Micromobility Summit in Copenhagen September 6

I’m Happy to announce that I’ll be hosting the Micromobility Summit at Techfestival this year. Taking place on September 6 in Copenhagen, the one-day summit explores how new technologies affect society, cities and urbanization in the very near future.

Join and contribute here

About Techfestival:

This September, Copenhagen will be home to 15,000+ people exploring a new, progressive agenda on technology. One week filled with 100+ conferences, summits, dinners, art installations and concerts, Techfestival’s goal is to break down today’s most complex questions into real talk and tangible experiences.f

App Story

The App Store is almost 9 years old. In that time it has generated about $100 billion in revenues, of which about $70 billion has been passed on to developers and $30 billion was kept by Apple. It’s very likely that running the App Store for 9 years did not cost $30 billion so, if it were an independent “business unit” it would probably have been and still be quite profitable.

But Apple does not run “business units” with separate Profit and Loss statements. The App Store is a part of Services which is an amalgamation of non-hardware sources of revenues but that does not mean it’s a business. The purpose of Services isn’t to turn a profit or define its value through some metric of financial performance.

The purpose of Services is to make the experience for the Apple user better. The combination of good experiences allows Apple to be perceived as a valuable brand and that allows it to obtain consistently above-average profitability through pricing power. I like to emphasize that the iPhone at over $600 in average price is more than twice the average price of all the other smartphones and captures over 90% of all available profits.

This is something that remains after a decade and indeed the price is rising in the face of overall price erosion, all without a decrease in volumes. The sustainability of this exceptionalism is due to no one single thing. It’s due to the persistence across all the things Apple does: product, stores, software and services and many other details too numerous to count.

The result is a large and expanding base of satisfied customers and a large and expanding base of partners both in hardware and software and services. The WWDC event this year showed how the ecosystem of Apple is booming with over 3 million new developers and Keynote screenfuls of partnerships. All this makes for a complex picture but it’s a real picture.

The latest numbers on Services try to tell this story: 180 billion App downloads from 500 million App store weekly visitors. The download rate is accelerating as shown in the following graph:

The revenue or payment rates can also be shown as accelerating though at a different rate. In both cases, the story of apps is not yet over, regardless of commentary to the contrary. Much of this growth comes from new markets like China and as India joins the iOS world, there is yet more opportunity emerging.

This enables part of the story of Services which can be tracked with several other metrics: reported revenues, iCloud accounts, active devices, and iTunes accounts are highly correlated.

The patterns after a decade are remarkably consistent. One would have thought that with mobile saturation in advanced markets, the content story would be told through horizontal lines. What we still see is the same slopes we’ve seen since the earliest days.

But the biggest story at WWDC was the re-design of the App Store as a curated content market. The changes are profound: discovery, curation and the surfacing of content have been revamped. It’s hard to predict the implications of this but one of the indications of direction was the separation of “Games” from “Apps”. This is a jarring idea since if all Apps are content, what makes Games different from other Apps? Is this a genre elevated to a new medium?

I can’t yet get a sense of where this is heading, if anywhere, but the remarkable story of Apps is that it’s still an ongoing story. We may be on chapter 2 and we can’t predict how many chapters remain.

Keep an eye on Apps and Services and developers. They are not lagging indicators of success for Apple. They are very much leading.

Predictably Profitable, Unpredictably Valuable

Predicting Apple’s yearly revenues has been fairly easy. The following graph shows the relationship between budgeted spending on Machinery, Equipment, Internal-use software, Land & Buildings and the shipment of iOS device revenues.

The company conveniently publishes a full-year forecast of these expenditures every fiscal year so by October we know roughly how sales will be during the following year. This pattern has held for 10 years so there is little uncertainty about the 11th year of iOS devices.

Continue reading “Predictably Profitable, Unpredictably Valuable”

Predicting The Second Quarter

The last quarter of 2016 was Apple’s biggest ever. $78.4 billion in revenues. 78.3 million iPhones. Both records. Earnings of $3.361 and cash reached new highs. The growth was modest but Services is now not just the second largest revenue but also the fastest growing, on track to doubling in four years.

The reason for this is the vastness of Apple’s user base coupled with the loyalty the brand engenders. The company reached one billion active devices more than a year ago and is quite likely to have nearly a billion users. Not just any billion either–the best billion most probably.

The realization that Apple benefits from extreme quantity and quality of customers has led some observers to defer the imminence of Apple’s demise. Share prices have risen lately to new highs and the ratios between these prices and earnings have started to come closer to the average of other large companies.

But enough with the reductio ad absurdum. Let’s look at the next quarter. The company has been very precise with its own offered predictions (guidance) so it’s a simple task to make an accurate forecast. The history of guidance vs. outcomes for revenues is shown below:

Placing the pipper on the upper edge of the guidance range was a safe targeting method for 11 of the last 17 quarters. We have never seen a drop below the bottom of the range but had a few overshoots, some huge. Doing this for the latest quarter and working backwards to the individual product contributions to revenue and using historical margin and cost patterns we can get the following core financial performance metrics:

Fiscal Q2 2017:
Rev ($B) 53.4
EPS ($/share) 1.96
iPhone (thousand units) 53100
iPad (thousand units) 9900
Mac (thousand units) 4100
Watch (thousand units) 2300
Services ($ million) 7129
Other products ($ million) 2300
Gross margin (%) 37.8

I sent these estimates to Philip-Elmer DeWitt and I recommend looking at his survey of the other analyst estimates on his excellent Apple 3.0 blog.

Overall, the quarter is shaping up to offer slight growth y/y and indicating a plateau formed after the surge from the iPhone 6 surge in ’15. All eyes are on the “super cycle” for the next iPhone.

The reason it’s “super” is that the iPhone has a 2+ year cadence for form factor changes and the user base updates on a similar cycle. The demand is vast due to the user base and accumulated age of devices in use. Expectations are that supply will be offered to meet this demand.

If history is a guide then the next iPhone will be the best iPhone ever.


  1. On shares priced at the time around $105 or 3.2% yield quarterly earnings []

Contact Less

In September 2016 Apple Pay came to support the world’s largest public transit system. It happened through the integration with Japan’s FeliCa and gave Apple Pay access to 160 million daily transactions.

This, along with many other milestones don’t get a lot of attention. Apple Pay is in what could be considered an attritional competition with non-consumption. There are no decisive battles won or lost, only the relentless pressure to make progress against a reluctance to change.

Before I go on, I should make the attrition/decisive type of conflict clear. The terms come from military science. A war of attrition is one where two sides essentially grind against each other and the winner is the one which lasts longest. A decisive battle is one where a conflict is won through a single, acute encounter where, due to either demoralizing or circumstance reasons, one side gives up. It’s the knock-out punch vs. the fight to exhaustion.

When applying this dichotomy to competition, we need to be careful about who we define as competitors. Note that I said that Apple Pay is in a fight with non-consumption. It’s tempting to say Apple Pay competes with some other payment system like Samsung Pay or Google Pay. But none of these alternatives are as powerful as the existing mix of contact payment systems: cash, credit card magnetic swiping and some other hybrid of codes and user experiences (especially online.)

When seen this way the challenger must compete through persistence. It’s impossible for Apple Pay to decisively defeat non-consumption in one battle. It takes literally millions of decisions for adoption: each consumer, each merchant, each bank, each point of sale. It’s a relentless grind of pitching, selling, demonstrating and shaming into action.

It’s been three years of this type of competition and progress may seem hard to spot. That is because we don’t see the big wins. We can only see small wins. The win in Japan, as significant as it might be (160 million daily transactions added to the addressable market) is still small compared to all transactions world-wide.

Continue reading “Contact Less”

iPad Optics

The iPad has an installed base of over 300 million. This is a far larger audience than that of the Mac (which has somewhere between 100 million and 150 million). And whereas the iPad acquired this audience in about 7 years, the Mac took 33 years.

Curiously however, it is the iPad that is seen as the more fragile product. The iPad is considered to be failing, with a presumption of an end of life in the near future. The evidence of this failure the year-on-year decline in units sold. This is illustrated by the following graph. Screen Shot 2017-03-23 at 10.05.21 PM

Note that the iPad decline is paired with a steady increase in the Mac. The iPad exhibits a four year decrease in overall volumes. This has, as they say, bad optics.

But what is seen isn’t all that might be,

If we look further we see that the iPad is still a much loved and much used product. Data from the Pew Internet Survey shows that tablet ownership among US adults increased from 45% in April 2015 to 48% in April 2016 and 51% in November 2016. The rise has been steady. Although this counts tablets, the iPad had 85% share of the U.S. market for tablets priced above $200 so it’s a fair assumption that the iPad audience is growing. Similar data exists for the UK.

Screen Shot 2017-03-23 at 10.11.50 PM

In addition, user satisfaction with the product continues to be very high. Apple cited that in November, 451 Research measured a 94% consumer satisfaction rate for iPad Mini, a 97% rate for iPad Air, and 96% for iPad Pro. Finally, browsing, shopping and app usage data also show continuing high utilization for iPads.

Furthermore, iPads are still growing in “non-consuming” markets. iPad posted double-digit growth in both Mainland China and India, it continues to attract a very high percentage of first-time tablet buyers.

Finally, within corporate buyers there is a 96% satisfaction rate with 66% purchase intent. Apps and solutions are continually being developed for the platform.

Taking into account that the iPad has a large, stable, engaged and loyal user base that continues to expand and find new uses the optically bad sales data needs an explanation. The simplest explanation is probably the best: iPads remain in use far longer than phones, and perhaps even longer than some computers.

Anecdotally we can see evidence for this. Few iPads are replaced every two years the way phones are. They are not tied to service contracts or subsidized. They are also less likely to be damaged during usage as phones are dropped and banged-up. iPads are more stationary or carried in protected containers. Phones are in pockets, iPads are in bags.

So iPads are longer-lived products and it’s perfectly reasonable that people who have them keep using them and more people are joining them but slowly. Note also that the decline in sales seems to be flattening out and perhaps might show stabilization.

Further countering of the iPad in decline idea is the continual improvement in the product. The latest is a refresh of the iPad with more battery life, a better screen and support for Pencil.

Perhaps the iPad will not return to rapid growth, or perhaps it will. But the more likely possibility is that the iPad will level out maintaining steady levels and, perhaps, grow slightly. This flat rather than up/down trajectory is unusual in devices but it isn’t when you look at the Mac. And isn’t the goal of the iPad to become a computer?  If so then perhaps Mission Accomplished.


Gravity

Apple is doomed. So are you. As mortals we are used to the idea of death. We do not dwell on it even though it’s inevitable. We do know that we’ll die but what we don’t know is when we’ll die. That certainty/uncertainty makes us, more or less, do everything that we do. And so we carry on. But companies die too. And when they die is also a mystery but it’s not at all clear that their inevitable demise determines what they do. If you think you’re immortal you may live dangerously. Perhaps as a result they live shorter lives than we do.

Life expectancy for humans has been rising but for companies it has been declining. Even more curiously, the richer you are the more likely you are to live longer but the wealthier a company, the more likely it is to keel over at any time. The longest lived small businesses live over 1000 years but the longest-lived large business is probably the East India Company that made it to the ripe age of 274. But that was before 1800.

In the modern, industrial era there are very few corporations that survived over a century and the Fortune 500 shows a turnover in inhabitants that resembles that of a plague-infested medieval inner-city. In contrast to their conservative, geriatric organic owners, synthetic companies are more likely to behave like live-fast, die-young punk rockers.

So it’s no surprise that Apple, at age 40, is seen as being well past its sell-by date. And yet it seems to be saying, somewhat faintly, “I’m not dead yet”. By generating more cash than can be comprehended by human observers and by controlling assets that are well beyond the means of many countries, they (it?) is confusing us with its persistence.

The confusion is exhibited in the following graph which shows the crises in confidence by that wonderful reflector of human perception–the stock market. By voting millions of times a day, the market shows us with great precision the totality of human emotion with regard to an asset. That emotion turns rapidly negative on Apple with surprising frequency.

Screen Shot 2017-03-16 at 2.32.03 PM

There have been over 8 bouts of collapsing confidence (exhibited by 40% drops in value) for Apple’s shares. Consider the latest where we’ve seen a 40% drop followed by 57% increase in share price over the last 12 months. 57% might not seem extraordinary for a small company but for the world’s largest market capitalization with the corresponding colossus of cash that it straddles, the robustness of brand and the loyalty of customers, the mind boggles.

The same thing happened in 2012 and 2008 and as far as I can tell the company has not changed one iota during that time. The same people, mostly, are in charge. With the same mission statement, and even the same product line. The resources, processes and priorities–the only determinants of the essential value of a firm–have not shifted.

One could try to suggest that even if Apple is unchanged, the world around it has changed. But if anything the world has come to match Apple’s own view: more mobile vs. fixed, more design vs. generic, more integrated experiences vs. more modular DIY.

The ethos of Apple is rigid so why is perception about the company so fickle?

If the graph above reflects perception about a constant entity then perhaps it charts how the world has changed rather than how Apple has. Perhaps perception revolves around a center of gravity far heavier and permanent. Perhaps the tug-of-war between fear and greed reflects more upon us that it does upon the object being observed.