Quantifying the phobia of owning Apple shares

As the market continues to exhibit signs of instability, an interesting paper[1] identified a correlation between the U.S. stock market and an index of the U.S. Financial Conditions. This index measures the assessment of the probability of a crisis.

The conclusion is that an imminent crisis mentality pervades equities markets today and implies that pricing is largely disconnected from fundamentals. On this blog we’ve discussed the topic of fundamentals and marveled at how pricing seems to be largely exclusive of it.

The case is made by the following chart: Continue reading “Quantifying the phobia of owning Apple shares”

Apple and comparables P/E ratios: Is punishment for growth being dispensed equally?

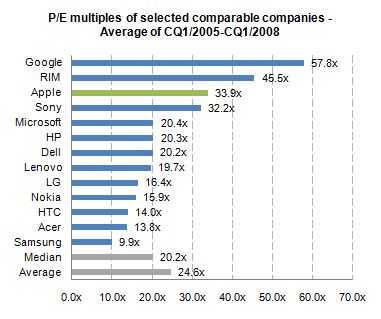
Apple’s valuation has been discussed several times on Asymco. Apple’s relative valuation in terms of P/E ratio has not improved since the recession despite an acceleration in financial performance. As Apple seems to be getting punished for growth, we have to also ask if it is the only one.

When looking at valuation from an institutional investor or financial analyst point of view, the most common methodologies are discounted cash flow (DCF) as well as comparable company multiples. Most often, a DCF valuation is performed and cross-checked with comparable multiples. The justification for using comparable companies is the exposure to the same market dynamics including, for instance, market growth and profitability. So to understand this perspective, let us focus on a peer group valuation by looking at the average P/E multiples[1] for the calendar quarters 1/2005 to 1/2008[2].


Continue reading “Apple and comparables P/E ratios: Is punishment for growth being dispensed equally?”

Estimates for Apple's fourth fiscal quarter: Entering the post-P/E era

I’m late with posting my estimates for Apple’s current (fourth fiscal) quarter. Normally I post my estimates a few days after the previous quarter’s earnings are announced. This quarter however there was a lot to think about.

As pointed out in my analysis of the previous quarter, the iPhone sold at a far faster rate than I thought. I had expected it would be a “lame duck” in the quarter but the expanding distribution allowed it to continue at a triple-digit growth rate (142% in fact, the highest quarterly growth rate since 2009).

So the question for this quarter is, as always, what’s the iPhone growth? The problem for me is that I have to choose between two assumptions:

  1. Due to distribution and dual product strategy (n-1 variant) production has now become more consistent.
  2. This quarter is the actual transition quarter when iPhone 4 production is throttled down in favor of the new model.

The first assumption would put the iPhone growth at 100%+ while the second would place it in the 60% to 80% range. I decided to dial in a figure somewhere in between at 90% but I’m not very confident in this until we see more evidence that a new pattern has emerged.

So here are my “mid” quarter forecasts: Continue reading “Estimates for Apple's fourth fiscal quarter: Entering the post-P/E era”

Apple's growth scorecard for second quarter 2011

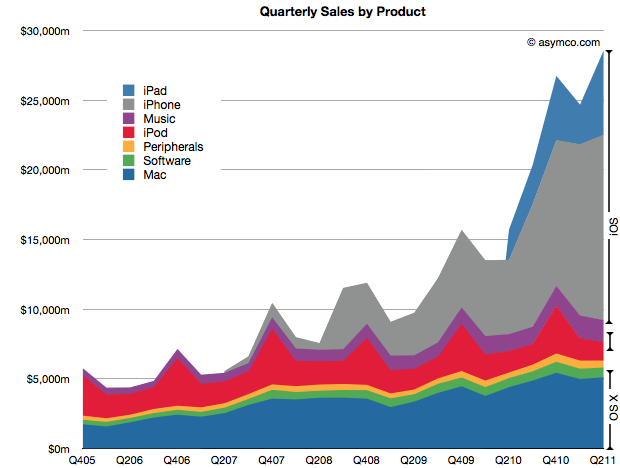
Apple’s second calendar quarter was a record breaking performance. This is surprising because it shows super-seasonal performance. For as long as I can remember the fourth calendar quarter (i.e. holiday) was always the strongest quarter, by a large margin. This quarter was higher than the last holiday quarter. A glance at the following chart shows the anomalous performance:

iOS products make up 71% of sales (and at least 78% of profits) which makes the following growth scorecard a bit moot.

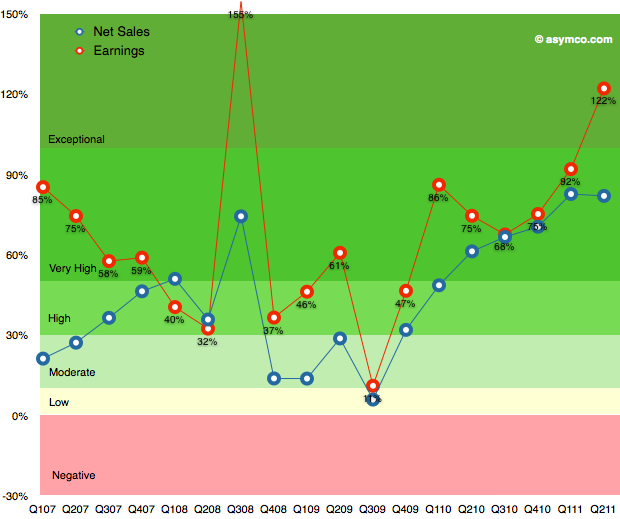
The growth in iPhone sales of 150% is hard to understand given the previous product cycle, but more about this later. The 122% growth in profits is (nearly) unprecedented. The growth in Q3 2008 was due to the launch of the iPhone 3GS and since there was no iPhone launch this quarter the growth shatters existing assumptions about the franchise.

The pattern in the table above is shown in the following chart:

This performance needs to be digested and contemplated a bit longer but I will make one early conclusion: One of the most common themes during the last year was that Apple’s growth rate was unsustainable. The theory cited was one of the “law of large numbers”. Apple’s performance shows it to be nonsense.

Instead of decelerating, Apple’s growth is accelerating.


How much is an iOS user worth to Apple? About $150. Every year.

During the last WWDC Apple revealed that there were 54 million active Mac users. If we look at the history of the product we can see that it took about 5.5 years to sell 54 million Macs. If we assume therefore that the average lifetime of a Mac is 5.5 years and knowing that Mac sales generated revenues of about $73.8 billion then we can estimate the average revenues/year/mac user: $250.

Repeating the exercise with 180 million current iOS users who purchased about 200 million iOS devices and assuming a life span of 3.5 years gives the average revenue/year/iOS user of about $150.

These are recurring figures. If we assume these users are loyal then they will likely spend this amount indefinitely and each additional user will be worth a similar amount.

So, for example, if we assume that the number of Mac users reaches 100 million then we can also assume that they will generate about $25 billion/yr in recurring revenues.

Likewise, if we extrapolate growth of iOS to 500 million users then we can assume they will generate $74 billion/yr in recurring revenues.

Adding these together gives a potential recurring income level of $95 billion/yr for installed base alone (excluding iPods, Peripherals, iTunes apps/songs, and Software sales.) Today that figure is about $40 billion/yr. [1]

Interesting valuation exercises can follow. [2] It would also be interesting to perform a similar analysis for other vendors/platforms.

Notes:

  1. Note that actual sales are considerably higher than this figure as new customers are added. These figures should be considered “baseline” sales.
  2. Thanks to a kind reader for suggesting this line of analysis.

Thinking over Apple's value

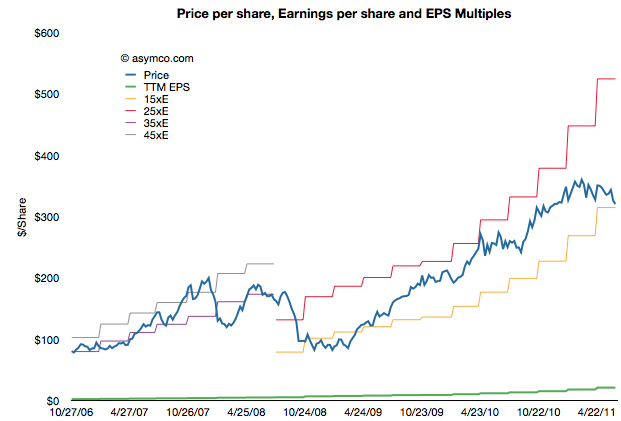
In intra-day trading Apple’s stock price traded at a P/E ratio below 15. That threshold is now at a price of about $315/share. Excluding cash the P/E is under 12. On a forward basis, there is widespread agreement that Apple has the reward (yield) profile of a bond without the risk of inflation.

The history of the P/E ratio and the share price is shown in the following chart:

As the chart shows, Apple traded in a range of P/E between 35 and 45 until late 2008 and has been trading between a range of 15 and 25 since about spring 2009. It might seem that the price is rewarding growth, but it’s not.

When adjusting for the growth the company has maintained, Continue reading “Thinking over Apple's value”

Staying Hungry

During the June 2005 Stanford University commencement speech Steve Jobs famously cited the farewell message placed on the back cover of the 1974 edition of The Whole Earth Catalog: “Stay hungry, stay foolish.”

That’s a nice, pithy statement. I interpreted “Being Foolish” in a Quora answer as “being naive about how things should be and thus allowing oneself to see how things could be.”

But what about staying hungry? Continue reading “Staying Hungry”

Combating superlatives fatigue

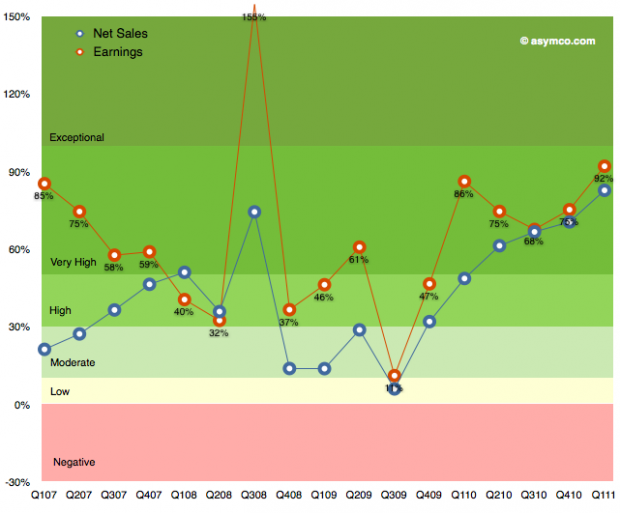
The following chart shows Apple’s growth for net sales and earnings over the last few years. I’ve used a grading system with color coding to show bands of growth.

It’s easy to become de-sensitized to the scope of these numbers, but it bears repeating: the growth has been steadily increasing since 2009.

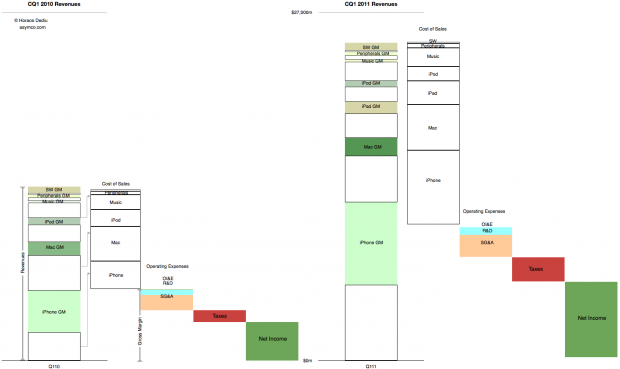
These abstractions in growth can also be shown in a direct “before-and-after” view of the income statement.

This latter view gives an idea of how much bigger the company’s business is now vs. a year ago. Not just on the revenues but also the cost of these revenues and what is retained.

This story never gets old.

Windows generates less than a third the profit of iOS + OS X

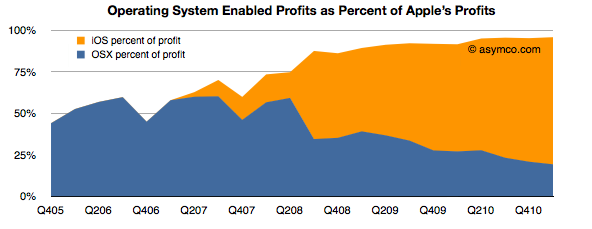
While a lot of the credit for Apple’s success is rightfully assigned to the iOS franchises, the OS X business has more than quadrupled in five years. This has happened without drastic price fluctuations. Neither holds for the overall PC industry which has seen both volume and sales decline while prices have eroded along with profitability. On top of that, growth has nearly evaporated.

Even with this success, as a percent of total value created, the Mac accounts for a mere 13% of Apple’s profit. Including software as part of the OS X franchise implies that OS X is enabling about 20% of Apple’s profits.

iOS, on the other hand, is accounting for more than 75%. These two platforms combined amount to 96% of Apple’s profits (up from 50% four years ago).

Continue reading “Windows generates less than a third the profit of iOS + OS X”

The market values Apple's balance sheet, not its income statement

As I have tediously repeated in this blog, Apple’s share price has been de-coupled from its earnings for many years. Consistent earnings growth above 70% is not seen as valuable. As the chart below shows, there is no correlation between EPS growth and value growth.

With the outlying quarter when 154% growth was matched by a negative 50% price change, the correlation does not look much better:

If we cannot correlate share price with growth then what is being valued? This has been a vexing problem because growth is the traditional, and logical, metric of valuation. Share prices, by definition (net present value of future cash flows) reflect future potential. That potential is more sensitive to growth than to anything else.

But I’ve been leaving one factor out of the share price definition. Share price is NPV of future cash flows plus current assets.

Since future cash flows are being thrown out of the equation, the company must be valued as a multiple of its cash. Does this relationship hold true?

In the chart below I show the weekly closing price of the shares and the corresponding value of the interpolated cash (and marketable securities) per share over the last two and a half years.

Continue reading “The market values Apple's balance sheet, not its income statement”