When exceptional growth is not an exception

Apple’s last quarter’s sales growth was an impressive 83%. It was not as high as the 92% earnings rise because there was a higher mix of iPhones this quarter than in the past. The iPhone is the most profitable product in Apple’s portfolio so it impacts the gross margin significantly.

The iPhone is, in fact, a huge part of Apple’s business. In units it reached 5% global share and 14% US share. I’ll go over the overall industry data as soon as all the major reports are in, but already it has been estimated that Apple is the largest phone vendor by profit and sales.

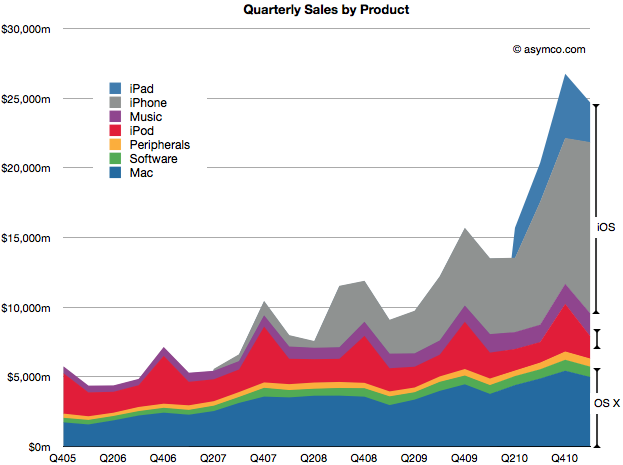
In the following chart, you can see just how important the iPhone has become. Together with the iPad and iPod touch, iOS-powered devices make up about 65% of sales. That’s almost three times the value of OS X based products which make up 23% of sales. That also leaves just 12% of sales not directly affected by these two juggernaut platforms (though music and peripherals are clearly indirectly affected by Apple’s own platform products.)

The following chart shows the same information as shares of total net sales. Continue reading “When exceptional growth is not an exception”

The Apple Growth Scorecard

Apple’s revenue for the first quarter was $24.7 billion, which at 83% was the largest quarterly revenue growth they ever experienced. Operating margin was an all-time high of almost $7.9 billion, representing 31.9% of revenue and yielding 95% EPS growth.

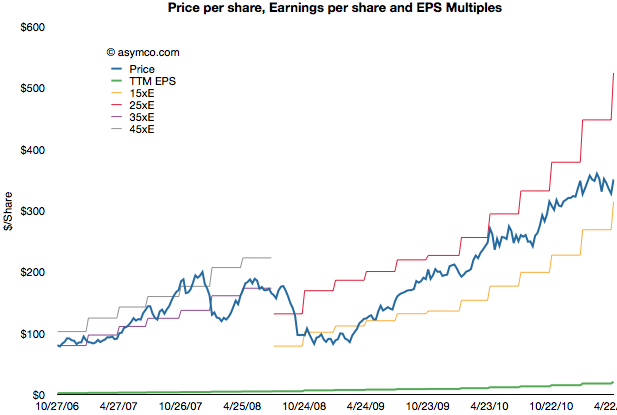
After earnings were announced the share price reached $350.7. This includes $70 in cash. Trailing twelve months’ earnings were $20.97. That makes the Price/Earnings ratio 16.7. Excluding cash, P/E is 13.4. The average growth over the past four quarters was 77%.

The following chart shows the share price vs. earnings. The green line is price and the blue line is share price. I also added multiples of the earnings to show how the stock traded in certain multiple bands.

During the period of 2006 to 2008 the company shares traded Continue reading “The Apple Growth Scorecard”

The iPad slowdown and impact from the Japanese disaster

Tim Cook explains that there was no material impact from the Japanese disaster:

“Regarding our global supply chain, as a result of outstanding teamwork and unprecedented resilience of our partners, we did not have any supply or cost impact in our fiscal Q2 as a result of the tragedy, Continue reading “The iPad slowdown and impact from the Japanese disaster”

Estimates for Apple's third fiscal quarter (ending June)

Apple’s CFO guidance statement:

We expect revenue to be about $23 billion compared to $15.7 billion in the June quarter last year. We expect gross margin to be about 38%, reflecting approximately $55 million related to stock-based compensation expense. We expect OpEx to be about $2.5 billion, including about $255 million related to stock-based compensation expense. We expect OI&E to be about $70 million and we expect the tax rate to be about 25%. We are targeting EPS of about $5.03.

Apple Management Discusses Q2 2011 Results – Earnings Call Transcript – Seeking Alpha

Last quarter Apple guided revenue growth at an aggressive 63% with an EPS growth of 47%. They delivered 83% and 93% respectively.

They are now guiding about 47% revenue growth and 43% EPS growth and my current estimates are 65% and 72% respectively based on the following:

  • iPhone units: 14.7 million (75%)
  • Macs: 4.3 million (25%)
  • iPads: 9.8 million (200%)
  • iPods: 8.0 million (-15%)
  • Music (incl. app) rev. growth: 25%
  • Peripherals rev. growth: 25%
  • Software rev. growth: 25%
  • Total sales: $25.8 billion (65%)
  • GM: 38.5%
  • EPS: $6.02 (72%)

The biggest uncertainty remains iPad growth. This will be the first quarter where we can dial in a y/y growth rate. I’m being bullish with 200% because I believe the ramp for the iPad 2 may get sorted out. There are also more countries being opened up this quarter (13 this week).

Apple’s stock price to earnings ratio has dropped to 16.72. Ex-cash it’s 13.5. On a forward basis (my estimates) it’s 8.3. Apple’s valuation is now a case for business historians to discuss because I don’t think there are modern precedents.


Is Android responsible for Apple's deep market discount?

At last night’s closing price Apple was trading at a P/E of 16.3. Excluding cash that ratio was at 13. On a conservative forward basis (my estimates) the stock is priced at less than 10 times next twelve months’ earnings.

These figures show a remarkable pessimism that has persisted around Apple for years. It was slightly, but not much, worse during the great recession. It persisted whether the company was growing at 30% of, as now, 95%.

There are many hypotheses about why Apple’s earnings and growth are considered worthless. They come and go with the whims of the age: recession, elitist, luxury branding, health issues, macro “headwinds”, earthquakes, phantom competition.

Lately it’s become fashionable to blame Android. That’s a curious thing to me, because Android has been discussed at length here and it has been shown to be, for the time being, benign. Apple has not “lost sales” to Android as it has been selling all it can produce. In some ways it’s been a boon as a co-belligerent against non-consumption.

Continue reading “Is Android responsible for Apple's deep market discount?”

Apple Earnings: Evaluating my performance

As chronicled here, this quarter I went through three sets of estimates. This is a departure from my standard practice of sticking with one forecast made three months in advance. I felt last quarter was filled with materially important developments which deserved updating.

So how did I do?

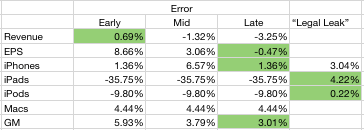
I wanted to see if the additional information helped or hindered predictability so I put my three predictions side-by-side and measured the errors. I also added the “legal leak” from April 15th (published April 19th) to see whether it was an accurate predictor. The table below shows the error rates with the lowest error highlighted.

Continue reading “Apple Earnings: Evaluating my performance”

Review of Apple's unit numbers released in legal filing prior to earnings

Thanks to Nilay Patel at This is My Next for posting the complaint filed on April 15th against Samsung by Apple which revealed some potentially material data about its performance in the last quarter (which won’t be public until the 20th).

On page 4:

“As of March 2011, more than 108 million iPhones had been sold worldwide”
“By March 2011, Apple had sold over 60 million (iPod touch) units.”

On page 5:

“By March 2011, Apple sold over 19 million iPads”.

These numbers are material because we know units sold prior to CQ1 and can derive the minimum units sold for these three product lines during Q1. Continue reading “Review of Apple's unit numbers released in legal filing prior to earnings”

iOS vs. Android: the tale as told by Wall Street

Yesterday I wrote about the growth in Android vs. iOS. The two platforms’ can be said to be enjoying healthy growth, though in markedly different patterns.

The consequences of this growth are being felt across the telecom and computing industries. There are almost 300 million platform devices in use today that were not even dreamed of three years ago. Operators are transporting petabytes more data and dozens of phone vendors are scrambling to meet demand. There are tens of billions of app downloads and hundreds of thousands of apps being sold by tens of thousands of new app publishers. There is a lot of hay being made while the sun shines.

But what about the poor saps that are funding the development? What about the shareholders of the companies behind these platforms. Are they being rewarded or punished?

The following charts tell the story: Continue reading “iOS vs. Android: the tale as told by Wall Street”

Revisiting Estimates for Apple’s second quarter earnings (ended March)

Estimates for Apple’s second quarter earnings ending March | asymco.

Since making the original estimates In January,

  • Revenue: $24.5 billion
  • EPS: 5.89
  • iPhone unit sales: 18.4m
  • iPod unit sales: 10m
  • Mac unit sales: 3.6m
  • iPad unit sales: 7.3m
  • Gross margin percentage: 38.8%

I revised them at the end of March to the following:

  • Revenue: $25 billion
  • EPS: 6.21
  • iPhone unit sales: 17.5m
  • iPod unit sales: 10m
  • Mac unit sales: 3.6m
  • iPad unit sales: 7.3m
  • Gross margin percentage: 39.6%

In the past I was comfortable keeping untouched estimates made three months in advance. This quarter however there have been several developments during the quarter which were unforeseen and cause me to revisit my estimates. Continue reading “Revisiting Estimates for Apple’s second quarter earnings (ended March)”

Pattern recognition for smartphone investors

I spent the last few days in Hong Kong at a conference discussing the smartphone industry. The participants were mainly investors or investment managers. One of the most frequently asked questions was how to spot investable trends in this notoriously unpredictable sector.

The data I presented did not offer much of an answer. If anything, it showed just how much the industry has changed and how unlikely it is to remain a facsimile of what it is today.

But theory allows us to still make some bold claims. Grounding your investment thesis in pattern recognition rather than extrapolation should be the better strategy. So here are the telltale signs I recommend watching for investable ideas. Continue reading “Pattern recognition for smartphone investors”