Predicting iPhone sales for dummies

Apple’s second fiscal quarter has just ended. Time for analysts to put forward their predictions for the quarter’s report (due in about 3 weeks.) If history is a guide, the estimates will range quite widely and accuracy will be determined mostly by the ability of an analyst to predict iOS device sales (and iPhone most of all).

How hard can it be?

Continue reading “Predicting iPhone sales for dummies”

Analysts: Apple's growth next year to drop to half of what it could obtain during the recession

Apple is having difficulty meeting demand for the iPhone and the iPad. It is growing both businesses at more than 100% and they make up about 65% of revenues, and 71% of profits. The Mac business is also growing at 2x to 3x the PC industry.

Being supply constrained makes it therefore a great challenge to forecast future growth for the company. Supply issues and ramp rates are needful of an operational expertise few possess outside of the industry. But many take up this challenge, myself included. We put up our numbers every quarter and get scrutinized and challenged for our failures.

So it’s always exciting to see how others are looking at the big picture. Continue reading “Analysts: Apple's growth next year to drop to half of what it could obtain during the recession”

Who will buy the next 150 million Symbian smartphones?

Stephen Elop stated that Nokia expects to sell approximately 150 million more Symbian devices before the transition to Windows Phone is complete. Assuming that figure is achievable (which is far from certain) I tried to understand how that figure will affect the volume and share numbers for Nokia in the coming years.

It’s very likely that the first WP phones will not ship in large volumes until 2012. Product development cycles being what they are, unless there is an ODM rebranding (i.e. taking an HTC phone and gluing a Nokia sticker on it) the minimum development time is at least 12 months. Keep in mind that Nokia does not have engineers to build such a product today and hiring them alone can take months.

The following two charts show what a two year forecast that adds up to 150 million Symbian devices looks like. I assumed Windows Phones begin to ship in 2012 and, keeping in mind that WP7 is designed for a higher hardware specification than the current Symbian phones, I show a modest ramp for a total of 15 million units in the first year. Continue reading “Who will buy the next 150 million Symbian smartphones?”

Summary view of Apple's income statement [Updated]

Since reporting on the 18th, I’ve mostly finished going over the the fourth quarter Apple data. Here is a quick summary of the articles that covered the financial and product performance:

Subject Article
Cash Having added $20 billion last year, Apple’s cash growth suggests total could top $100 billion next year
Growth Apple’s Growth Scorecard: 63% average earnings growth over 16 quarters
iPhone pricing The end of exclusivity doesn’t change the price operators pay for the iPhone
Sales by product 65% of Apple’s sales came from iOS powered devices
Next quarter’s estimates Estimates for Apple’s second quarter earnings (ending March)
Share price/valuation Is Apple a candidate for acquisition?
Margins and platform mix of profit iOS enables 71% of Apple’s profits. Platform products power 93% of gross margin
Cannibalization iPhone and iPad: Fine Young Cannibals?
Operational Expenses $76 billion a year from a tableful of products

That leaves one more: Summary view of cash flows. Continue reading “Summary view of Apple's income statement [Updated]”

$76 billion a year from a tableful of products

During the calendar year 2010 Apple spent nearly $2 billion in R&D. That is a significant increase from $714 million in 2006. However, as a percent of sales, R&D spending has decreased. Sales have grown more rapidly than resources hired to develop the products (or to sell them).

In Q4 2005 Operational Expenses (costs which are not tied directly to units of production–sometimes called fixed costs) were 14.2% of sales. In the last quarter of 2010, the ratio was 9.2%. Sales and administrative expenses (which include advertising, promotion and overhead) were 7.1% and R&D (which includes all engineering, testing) were 2.2%. As percent of sales both reached new lows. Continue reading “$76 billion a year from a tableful of products”

iPhone and iPad: Fine Young Cannibals?

The iPad and iPhone came, saw and conquered new markets. But since the products launched the question on every analyst’s mind has been on how much have these products “cannibalized” their brethren the iPod and the Mac.

This notion of “cannibalization” applies when a product is designed to compete and “eat” the share of another product in a company’s portfolio. It has some negative connotations since it implies loss but many times the thinking is that it’s better to cannibalize oneself rather than have it done by a competitor.

But have iPhone and iPad taken share from their competitors? Continue reading “iPhone and iPad: Fine Young Cannibals?”

iOS enables 71% of Apple's profits. Platform products power 93% of gross margin

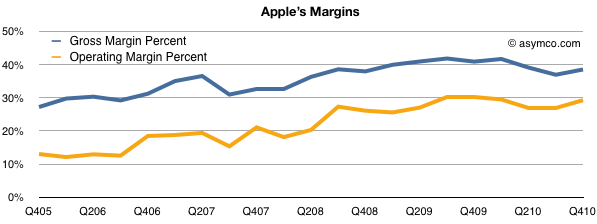
As the highly profitable iPhone makes up an increasingly larger proportion of Apple’s sales, the overall gross margin would be expected to grow.

Sure enough that’s what’s been happening.

The gross margin percent, which measures the direct or variable costs of production vs. price, shows a healthy rise in the last five years from slightly below 30% to around 40%. The Operating Margin, which also includes the overhead or fixed costs like R&D and SG&A, shows a similar rise, reaching about 30%.

Margin expansion while sales quadruple is a good indicator that a company is producing real value not just trading sales volume for profit.

Continue reading “iOS enables 71% of Apple's profits. Platform products power 93% of gross margin”

Is Apple a candidate for acquisition?

As shown in the Apple growth scorecard, the company’s earnings growth is continuing at 75% with the top line increasing at the annual rate of 70%.

The $59 billion of cash on the balance sheet has reached the equivalent of $64 per share yielding an enterprise value of $263 per share based on closing price of January 21st.

The stock price has been rising but not outside a narrow P/E band. The following chart shows the stock price and the 15 P/E and 25 P/E bands that have bounded it for nearly three years.

Continue reading “Is Apple a candidate for acquisition?”

The Bank of Apple: Using capital to ensure additional capacity and supply

When I wrote suggesting that the “best use of cash” was not acquisition but integration of manufacturing under the Apple control umbrella, the rumor that set off that discussion was that Apple was financing new facilities for its suppliers.

Those rumors were quashed, but we now know there is something to them.

During the September and December quarters, we executed long-term supply agreements with three vendors through which we expect to spend a total of approximately $3.9 billion in inventory component prepayments and capital expenditures over a two-year period. We made approximately $650 million in payments under these agreements in the December quarter, and anticipate making $1.05 billion in payments in the March quarter.

Apple Management Discusses F1Q11 Results – Earnings Call Transcript – Seeking Alpha [my emphasis] Continue reading “The Bank of Apple: Using capital to ensure additional capacity and supply”

Estimates for Apple’s second quarter earnings (ending March)

Apple’s CFO guidance statement:

We expect revenue to be about $22 billion, compared to $13.5 billion in the March quarter last year. We expect gross margins to be about 38.5%, reflecting approximately $50 million related to stock-based compensation expense. We expect OpEx to be about $2.35 billion, including about $250 million related to stock-based compensation. We expect OI&E to be about $50 million, and we expect the tax rate to be about 25.5%. We are targeting EPS of about $4.90.

via Apple Management Discusses F1Q11 Results – Earnings Call Transcript – Seeking Alpha.

This is a particularly aggressive revenue growth forecast of 63% (note again that Apple’s P/E has dropped to 18 and 14 ex cash and 10 on a forward basis) . Since Apple always guides very conservatively, the likely figures for the top and bottom lines are likely to be higher.

How much higher? Here are my estimates (growth in parentheses is year over year).

  • iPhone units: 18.4 million (110%)
  • Macs: 3.62 million (23%)
  • iPads: 6 million
  • iPods: 10.1 million (-7%)
  • Music (incl. app) rev. growth: 25%
  • Peripherals rev. growth: 23%
  • Software rev. growth: 23%
  • Total sales: $24.5 billion (82%)
  • GM: 38.8%
  • EPS: $5.89 (77%)

Looking a bit further ahead, earnings suggest the company is now trading at a forward P/E of about 9.5.