Turley Muller: Warranty Expense Crimps Apple's Margins in 4Q10

If estimated warranty expense had remained constant in absolute dollar terms ($150M), GM would have been 38.4% vs 36.9%. If If estimated warranty expense had remained constant in as a percentage of revenue (1%), GM would have been 130bps higher at 38.2%.

via Financial Alchemist: Warranty Expense Crimps Apple’s Margins in 4Q10.

Muller spots the culprit in the margin drop. He notes that this is money set aside and may have been in anticipation of returns of the iPhone 4 due to antennagate. Note how in 3Q cost of claims was 155 and accruals were 157, about a 1:1 ratio whereas in 4Q costs were 286 and accruals were 457 about 1:1.6.

It’s possible that if the costs this quarter do not materialize then we could see a margin upside surprise.

(Contrast this insight with today’s large scale sell-off in shares due to mass media repetition of earnings guidance from the conference call as shocking “news.” See also evidence of unlawful trading behavior here.)

Wall Street's Infinite Loop: How AAPL is valued

In the previous article discussing the growth scorecard, I left open the question of how Apple’s growth is reflected in its share price.

The approach to answering this question is to show how the share price correlates to that growth. The challenge for analysts has been that the company switched from subscription to current accounting for the iPhone (the largest component in its income statement). As they re-stated income and thus earnings, any historic review of P/E or other multiples of Earnings have to also be re-computed.

So this is what I’ve done: Continue reading “Wall Street's Infinite Loop: How AAPL is valued”

Apple's Growth Scorecard

Every quarter I try to score growth by top, bottom and product lines. As unforeseen growth is the only driver creating shareholder value, it’s of paramount importance to measuring a company’s performance.

For Apple, the analysis is fairly straight-forward. There are relatively few product lines (seven including the iPad). I measure y/y sales growth and try to form a picture that is easy on the eyes and mind.

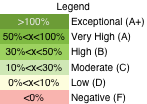
The method I’m using now is color coding growth for each line according to the legend to the left.

The table that follows shows each product plus the Net Sales and Earnings lines according to this color coding. I also added an average column for reference.

Continue reading “Apple's Growth Scorecard”

Visualizing Apple's Profitability

After the last earnings report, many noted that Apple’s gross margins dipped. Turley Muller noted in a letter to PED that the cause was probably the aggressive ramp in iPhone 4 production which broke new records at 14.1 million units.

That may be. My estimate of iPhone margin shows it dropping to about 49% from the more usual 55% (sometimes even higher).  We’ll never know exactly how much, but sometimes margins drop. RIM and Nokia are punished for drops in the GM percent so why shouldn’t Apple?

However, there are some other factors to consider: the overall margin is currently historically very high. As the high-margin iPhone makes up more of the total product mix, the overall margin should be growing. And it is. The chart below shows the trend since 2005. GM was in the high 20’s five years ago.
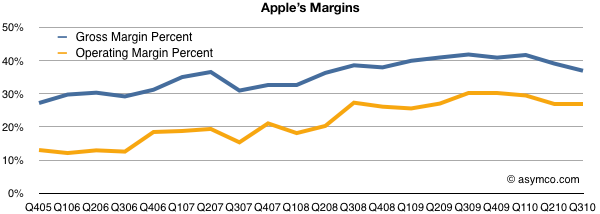
Note however the other margin: operating margin. After taking the fixed costs into consideration (which we saw to be shrinking as a percent of sales), Apple’s bottom line profitability has been rising slightly more rapidly than the GM. It has plateaued recently but not dipped significantly.

Also note that there have been dips in the past from which GM expansion resumed. One such dip was at the launch of the first iPhone in 2007, though we can’t be sure that was attributed to the iPhone itself or to other factors like that most cited by management: components costs.

However, the bottom line profitability is only part of the picture. It would be instructive to look at which product contribute how much. You won’t see this analysis often because the gross margin by product is not published by Apple and it takes quite a bit of guesswork to get there.

I maintain product-level gross margins and compute the overall GM bottom-up. The product-by-product line profitability is based on several assumptions which I won’t detail here, but those assumptions lead to the following contribution chart: Continue reading “Visualizing Apple's Profitability”

Estimates for Apple's first quarter earnings (January)

Oppenheimer on the concall:

We expect revenue to be about $23 billion compared to $15.7 billion in the December quarter last year. We expect gross margins to be about 36%. We expect OpEx to be about $2.325 billion.

We expect OI&E to be about $65 million. And we expect the tax rate to be about 25.5%. We’re targeting EPS of about $4.80.

Here are my expectations: Continue reading “Estimates for Apple's first quarter earnings (January)”

Deagol: Fiscal 4Q '10 actual results vs. estimates

Comprehensive and thoughtful review of the performance of the analyst cohorts in predicting Apple’s quarter:

Deagol’s AAPL Model: Fiscal 4Q ’10 actual results vs. estimates.

By Daniel Tello’s ranking I was first in Q2 but 8th (out of 38) in Q3. Overall, bloggers beat Pros but by a lower margin than in the past.

I have been ok at estimating product line performance and top line sales but not so good in guessing margins. Last quarter I went for a high iPhone number (13 million vs 14.1 actual and 11.39 Pro/12.07 Blogger consensus) and middle-of-pack on iPads (5 million vs. 4.2 actual and 4.79 Pro/5.52 Blogger consensus). The total iOS units I forecast was 18 million and Apple sold 18.3 so I was fine on units and pricing.

My guess on the cause of my estimate failure on margins was iPhone 4 rollout ramp. I had to take iPhone margin down to below 50% (about 49%) to make the reported total GM. iPhone has been, on average, running at 52% over the life of the product.

PED’s rankings are here.

AT&T does not pay a higher price for iPhone exclusivity

In last year’s third calendar quarter earnings call (October 20, 2009) Tim Cook was asked:

“So when you go from exclusive to multiple, you don’t change the charge to the carrier?”

Cook answered: “Correct.”

In this year’s third calendar quarter earnings call (October 18, 2010) Tim Cook was asked again whether the future iPhone non-exclusive subsidy will affect the iPhone revenues and again Tim Cook repeated that it won’t.

Chris Whitmore – Deutsche Bank

And what is your experience then when you’ve gone non-exclusive from a subsidy and margin standpoint on the phone, have you had to give anything up in the past? Continue reading “AT&T does not pay a higher price for iPhone exclusivity”

60 percent of Apple's sales are from products that did not exist three years ago

This chart speaks for itself. Note the bottom two bands and the proportion of the total that they make up.

Also note the seasonality with the holiday spikes. This last quarter is not a holiday quarter. Now imagine what next quarter will look like on this chart. Continue reading “60 percent of Apple's sales are from products that did not exist three years ago”

Apple OPEX: Never have so many owed so much to so few

Apple sales are growing faster than its operating expenses. Although all eyes are on gross margin, the company continues to run a tight ship in fixed costs (costs which do not vary with the output).

In terms of R&D, spending has dropped to 2.4% of sales, a level seen only once since 2005. Sales, General and Administrative costs also dropped to 7.7% of sales, a new record low.

The total operating expenses as a percent of sales stands at 10.2%. The following chart shows the trend. Continue reading “Apple OPEX: Never have so many owed so much to so few”

Apple's cash quintupled in last four years and doubled in last two years.

During the last quarter the company added $5.2 billion to its cash, long- and short-term marketable securities accounts for a total of $51 billion. This amounts to about $53 per share vs. $49.43 per share in July (making the share price about $250 ex-cash).

I would caution again that when reading commentary about Apple’s cash that many observers exclude long-term securities from the “cash” total.

To see the difference in the total, this chart breaks out the three different accounts over time. Continue reading “Apple's cash quintupled in last four years and doubled in last two years.”