Apple's P/E drops below 20 (again), ex-cash P/E at 16.44

Following earnings growth of 68%, after hours trading of AAPL at $300/share shows a P/E of 19.8. The company added over $5 billion in cash for a total of $51 billion or $52.9/share.

Excluding cash from the price of $300 leads to an enterprise value of $249 and a trailing twelve months earnings of $15.15. The ex-cash P/E is therefore 16.44.

P/E/trailing Growth is 0.29.

My guess is that this is keeping AAPL cheaper than the S&P 500 on both P/E and P/E/G.

Which size really matters? Market Share vs Profit Share

One of the most hotly debated subjects in the mobile phone business is the importance of market share. It’s also a topic of lore in the PC industry. Briefly the two arguments are:

  • Market share matters more because it drives network effects which ultimately drive competition out of the market, creating the opportunity for monopoly rents.
  • Profit share matters more because profit is the only fuel that can drive innovation. Any macro downturn or shift in strategy can cause a company to cease investing in unprofitable projects.

The old disruptor’s adage: “Be hungry for profits and patient for growth” is challenged by the equally disruptive: “Grow share with lower prices in exchange for new revenue sources.”

There are many rich anecdotes to support each strategy, but how about some data? Continue reading “Which size really matters? Market Share vs Profit Share”

CDMA iPad and the 150 million iOS devices next year

The Verizon distribution for iPad is an unexpected development. Coupled with distribution through AT&T stores, and rapidly expanding retail points of purchase, it seems that the iPad is destined to be the most widely distributed product Apple sells. The iPod never reached operator points of purchase and the Mac is orders of magnitude more constrained.

What seems to be happening is that Apple is pulling out all the stops and going for unrestricted iPad distribution. This may also foreshadow unrestricted iPhone distribution next year. It may also portend a CDMA iPad (or at least an LTE version) next year.

If it happens all estimates for next year need to be revised sharply. I had been expecting 100% growth for the iPad and 50% growth for the iPhone. These might need to be increased to 150% and 100%.

The consequence could be that total iOS devices sold could top 150 million for calendar 2011.

Goldman downgrades Microsoft, blames iPad

“We believe the intrinsic value of shares cannot be unlocked if the status quo remains, and we have increased caution near term on a more elongated PC refresh cycle, combined with the newer threat of notebook cannibalization from tablets, where Windows does not yet have a presence,” write Goldman Sachs analyst Sarah Friar and associates in the introduction to the report.

More advice about what to do about this in the linked article: Goldman downgrades Microsoft, makes case for major overhaul.

I’d skip over the recommendation to break up the company but the observation that Microsoft might face earnings threat from iPad is provocative. Usually it takes a few years for the incumbent to feel pain and react. The pain might be sooner than expected though the reaction might still take some time as the Windows Phone response to iPhone is taking its sweet time.

Updated estimates for Apple's fourth quarter earnings

We expect revenue to be about $18 billion compared to $12.2 billion in the September quarter last year. We expect gross margins to be about 35%…

We are targeting EPS of about $3.44.

via Apple Inc. AAPL Q3 2010 Earnings Call Transcript.

I’ve updated my estimates from the July forecast as follows: Continue reading “Updated estimates for Apple's fourth quarter earnings”

Apple's growth vs. top ten largest tech companies

In the last article I described growth vs. P/E and price change for the largest “ultra-large cap” companies, of which Apple features prominent.

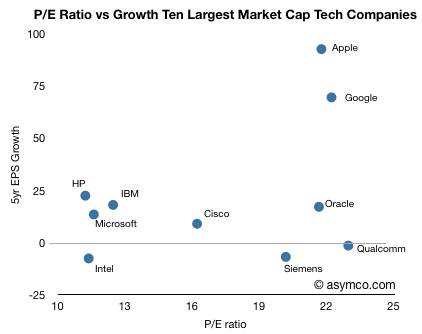
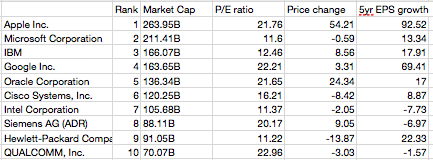
In this article I take the same analysis to the top ten largest technology companies (by market cap, see table at bottom).

In this comparison, Apple no longer has the largest P/E ratio. Qualcomm, Google and Oracle are all at similar levels of valuation relative to earnings, however Apple’s growth outstrips them, only with Google in the same quadrant.

Note the “Wintel” cohort consisting of Intel, Microsoft, HP clustered around the Low growth, low valuation quadrant in the lower left (coincidentally co-located with IBM). Oracle, Qualcomm and Siemens show high valuation with low long-term EPS growth. Cisco is somewhat on the fence.

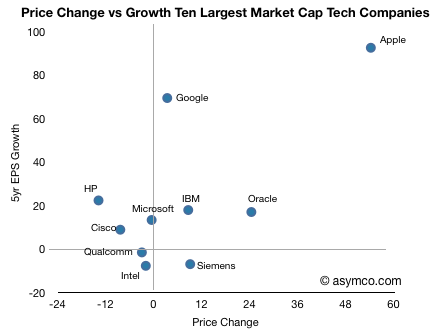
When comparing how the market has rewarded growth through share price appreciation, the correlation to growth is much better. Google seems under-rewarded.

Data follows:

Apple's growth vs. top 10 largest market caps

Apple’s stock price has been rising. Although it’s still priced at a P/E of 22 while facing near term EPS growth well above 50%, this is belated recognition of the potential of the iPad and the iPhone.

However, as it has grown, Apple’s valuation is now not only higher than any other technology company but it’s nearly the most valuable company on the planet. There is a theory that ultra-large market caps are reserved for companies that are past their prime. Sometimes this is attributed to the law of large numbers: that conclusion that big numbers cannot grow much bigger because compounding growth is exponential whereas markets are limited and become quickly saturated.

The trouble with this theory is that “large” is relative; large is often simply “the largest”. Large market caps are not what they used to be. During past booms, large caps touched a trillion dollars. Today, the largest market cap is merely $314 billion.

So I don’t put much faith in large number “laws”. The real question of under/over-valuation rests on whether the company is growing or not. Valuation is simply the net present value of future free cash flows (plus assets). So the most important determinant of current value is growth in cash flows.

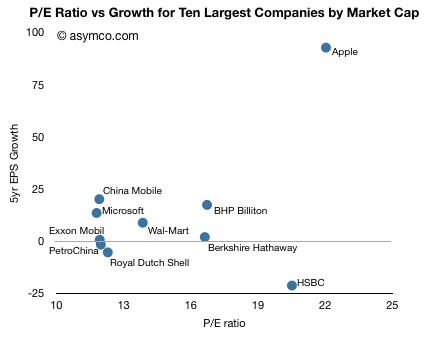
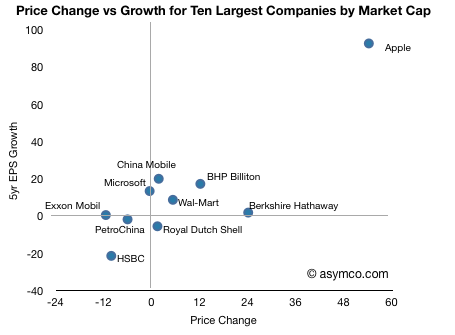
It’s fairly easy to assess this: compare P/E which is a proxy for valuation with EPS growth. The following chart does this for the top ten largest market caps traded on US exchanges (as listed by finance.google.com).

One should see some correlation between the two variables, but given the 5 year time frame, many of these companies showed large volatility. There are outliers like HSBC which has a rapidly rising value even though it was badly affected by the credit crunch.

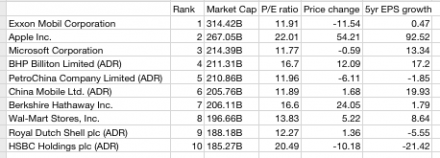
The other outlier is Apple. The company showed 93 percent EPS growth over a five year period and has a P/E of 22. The company with the next highest total value (Exxon Mobil) had 0.5% growth with a P/E of 12. The company with the next lowest total value (Microsoft) had 13.3 percent growth with a P/E of 12.

For an ultra-large cap, Apple’s growth is unprecedented and extraordinary. It’s in fact off the scale. The average growth of the other 9 top caps is 3.6 percent!

Apple’s growth is a factor of 25x higher. The P/E is only 1.6x higher.

The result has been a much higher appreciation in the stock price as shown in the following chart.

So it’s clear that Apple, in this peer group, is far from ordinary.

Data follows:

Forecasting iPhone production and sales

Analyst Jeffrey Fidacaro with Susquehanna Financial Group in a note to investors:

  1. Apple to build 3 million CDMA iPhones in December
  2. That would put total GSM and CDMA iPhone production for the quarter at between 21 million and 22 million.
  3. For the current quarter, Apple is set to build between 18.2 million and 18.4 million GSM-only iPhones.
  4. Expects Apple to sell a record 11.6 million iPhones in the fourth quarter of the company’s fiscal 2010. 39 percent q/q increase[1][see UPDATE below]
  5. As for the iPad, suppliers were said to have plans to build 7 million units for the current quarter, a 56 percent increase from the previous three-month frame.
  6. Expects Apple to ship 4.75 million units into the current quarter, 45 percent growth q/q, to a total of 13.4 million units in calendar 2010.

via AppleInsider | Suppliers say Apple will build first 3M CDMA iPhones in December.

What I don’t get from these numbers:

  • current quarter production: 18.2 million
  • current quarter units sold: 11.6 million
    • inventory at end of Q: 6.6 m units [I am assuming minimal inventory at start as iPhone 4 was just launched]
  • next quarter production: 21 million
  • next quarter units sold: ?
    • inventory at start + production = 27.6 million

My own estimate is for more than 12 (and up to 13) million units will be sold this quarter. I think inventory of more than half of production is too high for Apple. They usually carry only about 10% inventory.

My December quarter units sold may need revision but now stand at 14 million. If I substitute 14 million in the “?” above  then the inventory at end of December would be 13.6 million which would be nearly 100% of units sold–clearly unacceptable. Either production is too high or sales are too low.

I am at 4.7 million iPads for the quarter an 13.9 million for the year. No major difference in opinion.

[1] This forecast for 39% growth would make this quarter the second lowest growth quarter for the product. This makes is hard to believe because every launch quarter has usually been breaking records for growth. The 3G launch saw 516% growth and the 3GS saw 644%. To see 39% for the iPhone 4 makes me wonder especially as the comparable year ago quarter was not a launch quarter so growth should be off a low base. Last quarter, when the iPhone 4 was leaked and the channel was drained the product had 61% growth.

Compare also to the Mac which had 33% growth last quarter. Are we to believe that launch quarter iPhone growth is barely higher than Mac growth?

The figure of 11.6 million is also in-line with other analysts which seems to indicate another forecasting failure for the cohort.

[UPDATE] I checked the figures and 11.6 million iPhones is equivalent to 58% growth y/y. The (now corrected) article was citing q/q growth. However, 58% growth is still the second lowest growth quarter for the product.

It takes nearly $1 billion/yr to run iTunes

In recent articles I highlighted the acceleration in iTunes App downloads where the rate is approaching 18 million apps per day and the cumulative total apps which is about to overtake the cumulative songs downloaded.

We now turn our attention now to constructing the iTunes income statement: namely total sales, gross margins and deduce its operating budget.

Gross Sales

To obtain the top line (income) for iTunes we need to know the average selling price (ASP) for songs and for apps. Apps are easy, we received that info in June: $0.29 per app. For songs, it was easy before early last year: $0.99/song. After the selective price increase, the blended price needs to be estimated. I chose $1.10 for 2009 and $1.2 for 2010. These are just assumptions and can be adjusted but should give us a rough estimate:
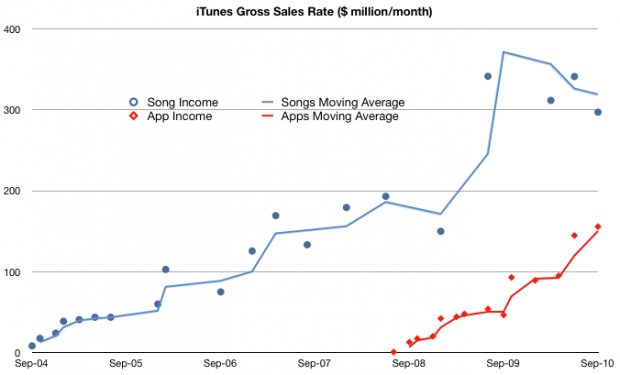
I followed the convention of using income rate or $/month to show the history of sales. It shows that even with a price less than a third of the music product, apps are generating over half of the sales of music. In other words, apps are adding 50% to iTunes sales today. If the decline in music units continues and the app sales increase with the current trajectory then app sales value will overtake music sales next year, consistent with the cross-over of cumulative units sold.

Gross Margin

If we know how much Apple pays music licensors and developers (i.e. cost of goods sold) we can calculate how much it keeps for operations (gross margin). Apple’s app margin is 30 percent. The music margin was never official but the consensus has been 10 percent for a while.

Using these figures, we get the following chart:
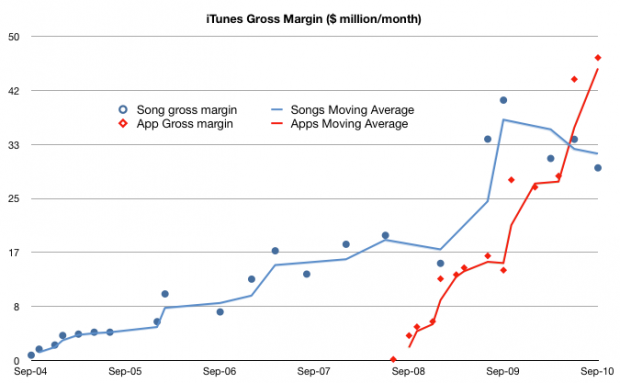
This shows that what is left after paying the content license, Apple “keeps” about $50 million every month to run the App store (iTAS) and another $30 million to run the Music store (iTMS).

The Operating Budget

Apple has made a point of saying that both iTAS and iTMS are run at “break even” implying that the gross margin is used up in operating costs (CAPEX, R&D, SG&A). To be sure, the cost of bandwidth and the data center(s) needed must be considerable.

But the operating budget for the store is beginning to reach a level that may be beyond what can be spent reasonably. The amount left over for operations has increased from ~$30 million a month in 2009 to $75 million/month today.

In fact, if this burn rate is maintained (even though it’s increasing) the operating budget for iTunes is nearing $1 billion/yr.

I’m not an expert on the cost of operating data centers but $ 1billion a year seems like a lot. I would love to see an analysis of how this could be allocated.

Implications

I would also add that because of the increasing mix of apps, the overall gross margin percent is increasing. I estimate that to be a blended 17%–a healthy margin for a content store–and an increase from 10% before the app store came online.

Finally, one implication of the economics involved is that a budget like this may provide a significant barrier to entry for any competitors looking to take on the iTunes juggernaut. iTunes has reached content critical mass (12 million songs), user base (160 million users) and wide distribution (23 countries for songs and 80+ countries for apps).

These are non-trivial operational issues that even the best in the “cloud” business models will find challenging.

Footnote:

This discussion excludes video sales, rentals, book sales as we don’t have solid histories for these product lines. However, we can do a spot check on the cumulative totals:

  • 450 million TV episodes downloaded implies $1 billion in sales.
  • 100 million movies downloaded probably adds at least another $1 billion
  • 35 million books adds another 500 million.
  • Compare with 11.7 billion songs at ASP of $1 for about $12 billion in song sales and 6.5 billion apps at ASP of $0.29 or about $1.9 billion.

iTMS content downloads have generated $16.4 billion in sales to date.

The race to a billion users

I took the venerable Consumer Platform Adoption Ramps chart and added Android and the latest data on iTunes, iPod and iOS.

To make it more readable (but conceptually more complicated) I put the data on a log chart.

Discussion

The time span covered is nine and a half years. The top of the graph marks the one billion threshold. Reaching one billion in less than 10 years is an interesting challenge for any platform and, at first glance, it seems that both iOS and Android have a shot at it. This does not seem likely for any of the other platforms.

The challenge is that as penetration grows, it’s natural for the slope for the lines to become shallower. Some platforms are simply not able to address one billion users:

  • i-Mode, AOL and other technologies with localized value networks are clearly limited to populations in their home countries.
  • iTunes is limited by the use of a PC, which has a small footprint in under-developed countries (dependency by iOS on iTunes should throw up a red flag here).
  • The iPod was embraced and extended by more ubiquitous mobile phones.

In contrast, mobile phones in general and smartphone platforms in particular have potential to reach a billion users (per platform.)

To wit, note that iOS and Android have similar curves to date and are both likely to overtake iPod and any other contender.

So for the obligatory theological question: Will Android follow the curve of iOS or will it diverge and continue on a steeper trajectory? Does it matter?

Discuss…