Quarterly Earnings Multiples: The new normal?

Based on the new iOS units numbers released I revised at the numbers for next quarter and it’s very probable that EPS will be over $5.25.

As recently as 2007 Apple was priced 50x one year’s earnings.

Now it’s priced 47x one quarter’s earnings.

Should we consider applying old yearly earnings multiples to quarterly earnings as the new valuation normal?

22 Million iPads in F2011

Ghai now estimates that Apple will sell 5.75 million iPads in the quarter that ends Sept. 25, up from an earlier estimate of 5 million, and 22 million in fiscal 2011, up from 19.5 million.

via The iPad as Trojan horse – Apple 2.0 – Fortune Tech.

That’s very close to my estimate of 21 million, though I might add that my estimate is unrevised since US supply met demand. There are still markets which don’t have iPad distribution however, so we’ll see if global demand can be met before year end.

By the way, the estimate of 5.75 million for this quarter is higher than all but three of 14 analysts estimates on iPad unit forecasts *for the first year*.

Apple trading at a discount to the S&P 500

Flush with $45 billion in cash and investments ($50 per share) and no debt, Apple sports an enterprise value of about $190 per share. Compare that to $15 of earnings this year and enough catalysts to make next year’s estimate of $18 seem easily attainable, and you have a stock that actually trades at a discount to the S&P 500.

via Why Apple’s Stock Actually Looks Cheap — Seeking Alpha.

This is not news around here

The next 100 million iOS devices part II

Brian Marshall, an analyst with investment firm Gleacher & Co., predicts that Apple will have sold 200 million iOS devices by this time next year. He expects the iPhone and iPad to represent 68 percent of gross margins for 2010.

via Apple’s mobile OS could move to more devices.

My expectations for the next 100 million were made in June:

My expectation is that well over 100 million iOS devices will sell during 2011, but even during the next 12 months (2H ’10 and 1H ’11) the total may well reach 100 million, making 200 million installed by June 2011 very likely.

The next 100 million iOS devices

My current expectation is that iPhone and iPad will account for 70 million additional iOS units for the twelve months following this June quarter. This excludes any Apple TV units moving to iOS.

As iOS moves to more of the iPod line-up it’s quite possible that another 30 million iPads with iOS will ship in the same time frame making Marshall’s forecast sound reasonable.

ADD this: Apple's Balance Sheet

Only on Asymco…

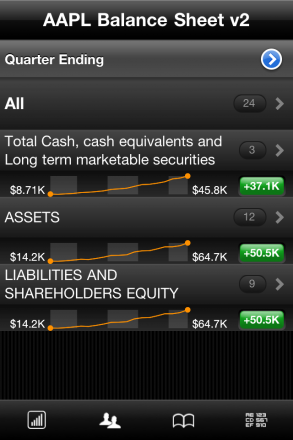
Let your fingers do the walking through Apple’s income statements since FQ1 2005. Glide effortlessly through juicy bits of assets and liabilities. Slide your finger through nineteen quarters of financial goodness.

A special bonus: included is a separate visualization of Apple’s liquid assets: cash, cash equivalents, Short-term marketable securities and Long-term marketable securities. $$$$$!

Brilliant to use and look at on both iPhone, iPad and iPod touch:


Continue reading “ADD this: Apple's Balance Sheet”

Bond market discounting Nokia's credit rating

The world’s largest mobile-phone maker’s bonds are trading as if Nokia’s rating has been cut, with spreads over government debt widening as the company strives to develop devices with the same mass appeal as the iPhone, Research In Motion Ltd.’s BlackBerry and devices based on Google Inc.’s Android software.

There’s a “significant amount of risk overall with Nokia’s business model,” said Scott Shiffman, who directs bond research at Chapdelaine Credit Partners in New York. “Credit spreads should move wider over time and ratings will continue to move lower. We think the ratings agencies will play catch-up to the business deterioration.”

via Nokia’s Credit Rating in Jeopardy on Falling Profit, Bonds Show – Bloomberg.

Management response continues to be that Nokia is “by a very wide margin the largest supplier of smartphones and small computers in the world.”

HTC: How They Compare

In the last mobile market update series I wrote of  the evolution of market share, the shift in where dollars are spent, the tale of ASP erosionprofitability ratios over time and EBIT share over time.

I did not include all vendors for various good reasons. The first survey (market share) did include an “others” category that made the volume data complete, but in the financial data sets, I chose to include the top 7 vendors that make up 80% of device volumes.

One noteworthy vendor that was not included was HTC. HTC is an important vendor for several reasons:

  • it’s a pioneer in smartphones having made the first Windows Mobile devices and the first Android devices
  • at one point it sold 80% of all Windows Mobile devices
  • even if it did not brand its devices, it was the name behind many re-branded or white-label operator branded phones
  • it has a brand of its own today and is expanding its reach

HTC has been around building devices since 2001 and so it would be a pity to exclude them from any analysis of the effect of iPhone on the market or any discussion on the effect of smartphone disruption on feature phones.

The challenge with HTC was that historically their branded devices and white label devices were not reported by the company separately. This matters because white label devices are valued differently. Typically these devices are not marketed by the original manufacturer so SG&A is not applied to their cost base. Operating margins, ASPs and hence profitability is not directly comparable with other OEMs.

But HTC has recently changed its reporting. Thanks to a reader I discovered that, since 2008, HTC has been listing its ASP and Operating Margin making direct comparisons possible. I still don’t have all the data, but enough to add HTC to the analysis.

So, here are the 5 industry performance criteria, now with eight vendors listed.

Continue reading “HTC: How They Compare”

Android's Pursuit of the Biggest Losers

The mobile phone market is intertwined with the telecommunications industry which is vast and there are numerous competitors which are much more dynamic and better capitalized than the moribund PC or music player vendors. It’s also a regulated and fragmented global market with 1.2 billion units and 5 billion consumers—far greater than any of the markets Apple played in for its first 30 years.

Nevertheless, the iPhone has had a huge impact on the industry. To show just how much of an impact, I dove in and pulled over 500 data points on three years’ financial performance of seven competitors responsible for 80 percent of units being shipped today. The time frame covers the iPhone’s participation in the market so it allows for “before-and-after” comparisons.

I divided the findings into five articles:

  1. Unit Volumes. The evolution of market share.
  2. Revenues. The shift in where dollars are spent.
  3. Selling prices. The tale of ASP erosion.
  4. Operating margin. Profitability ratios over time.

Now I turn my attention to draw a bottom line from all the data above, namely the operating earnings (EBIT or Earnings before Interest and Taxation).

The first chart shows the EBIT from the top seven vendors of mobile phones since the quarter when the iPhone launched. I annotated Nokia and Apple’s bars to give perspective.
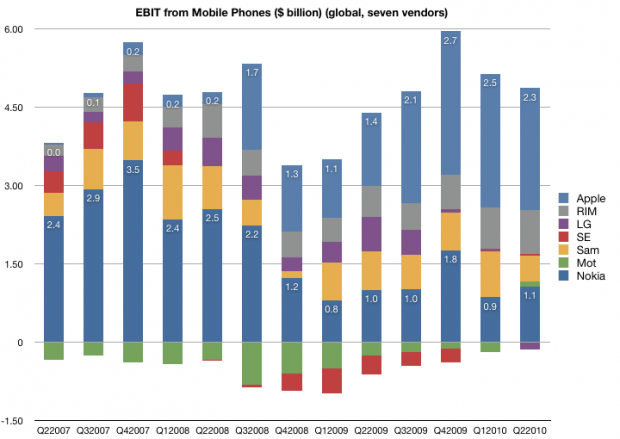
The total available profits in the industry dipped to a bit under $4 billion at the trough of the recession, and have recovered to nearly $6 billion in the holiday quarter last year. However, not all vendors are profitable. As you might expect from looking at the operating margins, Motorola and Sony Ericsson have been generating losses for most of this time period. They have both reached profitability in the last quarter, though at very low levels and after having lost a large part of their sales. LG has turned negative this past quarter after being a modest earner for some time. Samsung has maintained a fairly even consistency in its profit capture, though with its expanding market share, it seems to have come at the cost of pricing.

Finally, looking at the pure smartphone vendors RIM and Apple, the picture is nothing short of astonishing. This before-and-after share-of-available-profit chart shows that the two entrants went from about 7% profit share to 65% in three years.
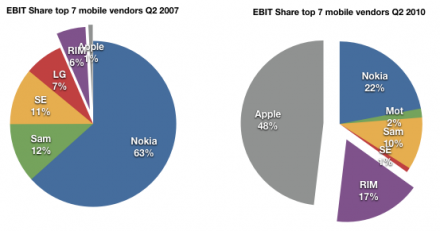
Apple in particular is capturing about half of the available profits with three percent of the units. It dwarfs all the other vendors, more than double the nearest (Nokia). All that in three years and with the added burdens of only three models, a recession and limited distribution.

What does it all mean?

Here are my conclusions, enumerated:

  1. The lack of a real response. The recurring theme in this series of articles has been that giant multinational incumbents in a vast and rapidly growing industry, enjoying all the advantages that size and incumbency, have had their profits taken from them. And they don’t seem to have put up much of a fight.
  2. It’s all wealth transfer. Note the total amount of profit available has not increased markedly; this is not about incumbents growing the pie. Two thirds of what should have rightly been theirs moved from the incumbent shareholders to the entrant shareholders.
  3. Speed. This shift of profit occurred over an unprecedentedly short period of time.  Three years is no more than two product cycles in the industry and it’s an order of magnitude faster than what happened historically to other industries.
  4. Disruption is the diagnosis here. The incumbents were caught in the headlights. Disruptive innovation leads to asymmetric competition and this is what we just witnessed. History has shown that the shift of profits is usually the last stage of disruption and is usually irreversible because the change in business models cannot happen at the rate of change of profit transfer.

Which leads me to one final point.

When analyzing the potential for challengers to the new winners, the most cited is Android. Can Android affect this redistribution of profit once again? And to whom?

If Android is to become the dominant platform, does it depend on the success of its licensees? Who are these licensees and what are the chances that they will be able to align their businesses to what Android offers (a new revenue model based on services and advertising).

One problem I see is that Google is making a bet on those same vendors who are now squeezed in the middle of that last pie chart: Samsung, LG, Motorola and Sony Ericsson. Nokia, Apple and RIM will certainly not take the OS over what they already have as it dilutes their differentiation and margins. That means Android is aligned with the biggest losers in the industry.

So how likely are these disrupted ex-giants to recover and take Android forward? My bet: slim to none. Android does not offer more than a lifeline. It is not a foundation for long-term profitability as it presumes the profits accrue to the network and possibly to Google. Profit evaporation out of devices to Google may be a possibility at some time in the future, but only if the devices don’t need too much attention to remain competitive. But because they’re still not good enough (and they won’t be for years to come), it’s certain that attention to detail is what will be most important to stay abreast of Apple.[1]

So here we have the real challenge to Android:  partnership with defeated incumbents whose ability to build profitable and differentiated products is hamstrung by the licensing model and whose incentives to move up the steep trajectory of necessary improvements are limited.

In other words, Android’s licensees won’t have the profits or the motivation to spend on R&D so as to make exceptionally competitive products at a time when being competitive is what matters most.

[1]: I would argue the same lack of symmetry with licensed software vendor Microsoft is what led the the failure of the same incumbents to make a dent in the industry with Windows Mobile [2003 to 2010].

Phone incumbents' average operating margin: 4.5%. RIM and Apple: 34%

After ASPSales, and Unit Volumes we look at the three year history of operating margins for the seven most significant mobile phone vendors (Nokia, Samsung, LG, Motorola, Sony Ericsson, RIM and Apple).

The following chart shows the OM from mobile phone sales. These figures are as reported by the companies with the exception of Samsung and Apple. Samsung reports OM for its telecommunications unit as a whole and we have to assume that it’s largely accurate for mobile phones. Apple does not report margins for its iPhone but it’s possible to estimate gross margin percent for the iPhone and then subtract its overall OPEX as percent of sales. This assumes that OPEX is allocated to the iPhone in proportion to sales, which is the best assumption we can make at this time.

The data shows that the iPhone has been considerably more profitable, due mostly to a high ASP, than other vendors. Motorola and Sony Ericsson have been “underwater” with respect to margin for much of the time period, with LG recently dipping into the red.

Nokia’s margin erosion is a source of significant angst but note that it has just reached Samsung’s historic level (around 10%). LG, long seen as an up-and-coming vendor who took over the number three spot from Motorola is shown to have done so with moderate-to-low profit margins.

Overall, the phone incumbents have an unweighted average operating margin of 4.5%, down from 8.6% three years ago. In contrast, RIM and Apple have an average OM of 34%, up from 24%.  In other words, profitability has halved for the volume leaders while it has increased nearly by half for the entrants.

This goes a long way toward explaining the “smartphone gap” which is being filled by Android. As vendors see their unit growth, ASP and operating margins under pressure from low end disruptors, there is a tendency to flee to the high end that smartphones represent. Android offers an irresistible siren’s song.