Estimating Fourth Quarter Earnings for Apple

We expect revenue to be about $18 billion compared to $12.2 billion in the September quarter last year. We expect gross margins to be about 35%…

We are targeting EPS of about $3.44.

via Apple Inc. AAPL Q3 2010 Earnings Call Transcript.

That $18 billion figure is extraordinary.  Consider that last year during the same quarter, the company received $12.2 billion, then the sales growth forecast is about 50%.  Granted that even though Apple just achieved 61% sales growth last quarter, Apple management is unusually aggressive in underestimating.

Given this, I am looking at the following forecast:

  • iPhone units: 12.2 million (65% growth)
  • Macs: 4 million (30% growth)
  • iPads: 3.3 million (flat sequentially, production constrained)
  • iPods: 9.4 million (-8% growth)
  • Music growth: 26.7%
  • Peripherals growth: 21%
  • Software growth: 8%
  • Total sales: $19.0 billion (56% y/y growth)
  • GM: 42.3%
  • EPS: $4.78 (73% y/y growth)

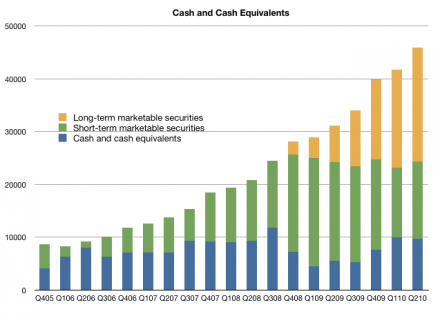
If this estimate proves correct, then at the end of the quarter (Oct 1) the trailing twelve months’ earnings per share will be $15.29.  That is equivalent to P/E of 16.82 on the back of four quarters of earnings growth (47%, 86%, 75% and 73% respectively).  The price/earnings excluding cash would be 13.4.

3Q review: The iPod revenues increase again

The iPod touch increased sales 48% year-over-year.  The continuing mix shift toward iPod touch resulted in an overall iPod ASP increase of 12% to $164 (up from $143) generating total iPod revenue growth of 4%.

Units declined 7.9%, inline with my expectations of -8%. I had forecast 9.40 and the actuals was 9.406 million. I note that most amateur analysts over-estimated iPods with my guess being the second lowest.  It’s important to consider just how much the iPhone (and iPad) cannibalize the non-iOS iPods.

I am estimating gross margin holding steady at 28%.

Looking forward I am forecasting ASP of 170 and unit growth of -8%.

I’ll also mention here the Music business.  Revenues grew at an accelerating 26.7%. This growth is a significant rebound from the 15% to 22% growth of 2009 though lower than the 30%+ range of 2007 and 2008.

3Q review: The iPad adds over $700 million of operating profit with an average selling price of $662

The iPad units numbers were not a surprise (except perhaps to some of the professional analysts who do not read Apple’s press releases). Among the more accurate (amateur) analysts, the range was from 3.2 to 3.45 million with an average of 3.32.  My estimate of 3.3 million was the mode of the distribution.

Apple sold 3.270 million in the first ever quarter.  The ASP came in at $662.39, below my expected $700 but higher than the iPhone.

The only unknown is the gross margin.  Given the overall GM and the other products’ margins, I am backing out a 33% margin for the quarter.  I had expected 40% but the lower margin may be a result of launch quarter issues (shipping and allocation of stock) and perhaps a lower target margin for the product.  It should be noted that the iPad margin sits between the Mac and iPod (around 30%) and the iPhone (around 60%).  The iPad is a new category that sits between the Mac and iPhone in terms of usage and it seems it sits also half-way in terms of margins.  Going forward, I’m still modeling a 40% GM for the iPad.

Overall, I estimate the iPad added $717 million of operating profit to Apple’s bottom line. Not bad for a product that was almost universally panned on launch day.

3Q review: Mac units grow 33%

Apple Reports Third Quarter Results.

I was surprised by the poor predictions of Mac units by the analyst community with estimates ranging from 2.86 million to 3.51.  It was fairly clear to me early in the quarter that the product would get 30%+ growth.  There was little news except overall Mac momentum to shape the forecast and it seemed logical that the growth would stay inline with the last quarter which was 32.8%. I dialed in 33% after the first month and stuck with this so my forecast came out to 3.46 million.

In the event, 3.472 million were sold for a growth of 33.4%.  The ASP came in at $1,267, slightly down from $1,278 last quarter and $1,289 the year before. ASPs are eroding but Apple are holding the rate down with product updates. Looking forward, I’m forecast $1,300 ASP.

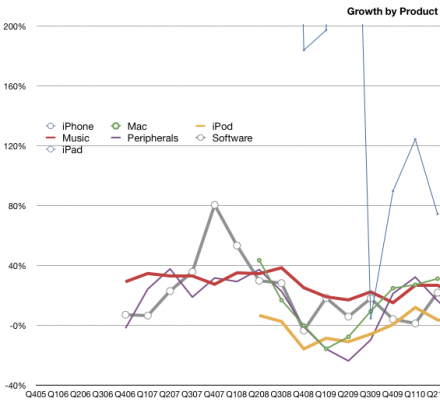
I estimate gross margin for the Mac at 27%. This is down from 31% a year ago. Revenue growth year-on-year was 31%.  The Mac  franchise is still doing better than most PC vendors and is gaining share. The graph below shows the growth by product revenues.  The Mac is now the second fastest grower after the iPhone (the iPad is not included yet as these are y/y growth rates.)

3Q review: iPhone revenues grow 74%

Calling the iPhone this quarter was going to be a challenge. This was a transition quarter where an old lead model would be replaced with a new one. The launch of the iPhone 4 was going to affect the volumes, but nobody could predict how. We’ve had a few such quarters and they were volatile. The number of sales days varied and the distribution of the old product was much different. The problem was compounded by the leak of the prototype and the uncertainties of launch day logistics. My forecast had been 8.5 million units.

In the event, 8,398,000 iPhones were sold. This included 1.7 million iPhone 4s which means about 6.7 million 3GS phones sold. That’s quite remarkable given the end-of-cycle timing.  8.7 million 3GS were sold in Q2 which means the sell-in was down only about 2 million for the transition.

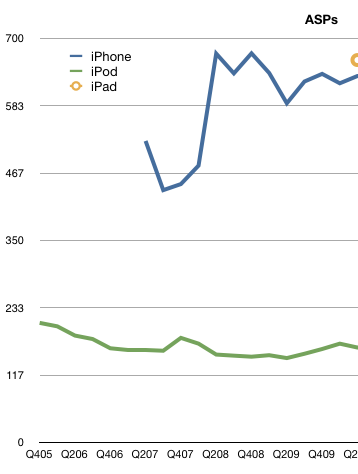
The even more remarkable story is the average selling price. It came in at $635.15. The iPhone has ranged from $437 to $674 ASP over the last three years (see chart). This figure places it near the top of the range, a great performance for the end of a product cycle quarter.

I estimate gross margin at 56%, a drop from the more typical 60% due to iPhone 4 launch. With revenues of $5.33 billion and cost of sales of $2.2 billion, Apple created operating profit of $3.13 billion–we’ll take a look at that number relative to other vendors later.

Growth year-on-year were 74% for revenues and 61% on units. For a transition quarter, these numbers are spectacular. For comparison, during 2009’s transition quarter (Q4) revenues grew at 5% and units 7%. Furthermore, according to Apple’s management, iPhone unit sales in the June quarter were running 90% above the year-ago period prior to the company draining thechannel ahead of the iPhone 4’s release. In the December and March quarters, unit sales were 100% or more above prior-year results. This means that 100% growth is sustainable though going forward I’m keeping forecast at 65% growth.

Seventy percent revenue growth cannot be seen as anything other than a sign of rude health.

Accuracy of Sales and Earnings Estimate

Earnings Smackdown: The best and worst Apple analysts – Apple 2.0 – Fortune Tech.

From the data above, it’s clear that although my accuracy on units and sales was pretty good, my EPS was too high. The reason for this was the lower margins for the iPad. It’s very likely that these margins will improve after the launch quarter (as they did for the iPhone).

Accuracy of Apple unit volume forecast

From Apple’s FQ3 press release:

“Apple sold 3.47 million Macs during the quarter, representing a new quarterly record and a 33 percent unit increase over the year-ago quarter. The Company sold 8.4 million iPhones in the quarter, representing 61 percent unit growth over the year-ago quarter. Apple sold 9.41 million iPods during the quarter, representing an eight percent unit decline from the year-ago quarter. The Company began selling iPads during the quarter, with total sales of 3.27 million.”

My unit forecast.

In millions of units.

Product Asymco Actual Diff Error
iPhone 8.500 8.398 0.102 1.2%
Mac 3.462 3.472 -0.010 -0.3%
iPad 3.300 3.270 0.030 0.9%
iPod 9.398 9.406 -0.008 -0.1%

Rankings of various analyst forecasts are at :
Deagol’s blog.

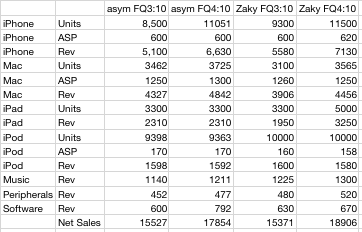
Asymco estimates for Apple's third fiscal quarter

The third fiscal quarter is at an end and it’s time to estimate performance.  Andy Zaky has kicked off earnings season with his detailed accounting of what could be a $63.5 billion year for Apple.

I put forward below my estimates side-by-side with Zaky.  I come in at $62.6b for the year, differing by just under $1b or 1.6%.

His numbers are certainly within what I would consider a margin of error of mine.

My estimate for iPhones this quarter are lower due to possible slowing of sales before the iPhone 4 launch.  My Mac numbers are higher based on some early estimates of industry pick-up. I concede that my FQ4:10 iPad estimates are low, but sticking with them for now.

Analysts predict iPad sales (part III)

Apple Sells Three Million iPads in 80 Days – Yahoo! Finance.

After 1 2 3 million units sold in 28 60 80 days, it’s time to review the analysts’ predictions:

First year iPad unit forecasts (sourced from TMO Finance Board)

  • Brian Marshall, Broadpoint AmTech 7.0
  • David Bailey, Goldman Sachs 6.2
  • Kathryn Huberty, Morgan Stanley 6.0
  • Shaw Wu, Kauffman Bros. 5.0
  • Mike Abramsky, RBC Capital Markets 5.0
  • Gene Munster, Piper Jaffray 3.5
  • Ben Reitzes, Barclays Capital 2.9
  • Keith Bachman, BMO Capital 2.5
  • Jeff Fidacaro, Susquehanna 2.1
  • Chris Whitmore, Deutsche Bank 2.0
  • Scott Craig, Merrill Lynch 1.2
  • Peter Misek, Canaccord Adams 1.2
  • Doug Reid, Thomas Weisel 1.1
  • Yair Reiner, Oppenheimer 1.1

Looks like at least half two thirds three quarters of these guys have already blown it.

For the record, in January I forecast 6 million units for calendar 2010 (and 10 million in first year).  It looks like I’ll be facing the iPad dunce corner as well.

See: Analysts predict iPad sales Analysts predict iPad sales (part II)

Apple considered less valuable than the average S&P 500 company [Updated]

Apple just reached a new all-time closing high.  It’s remarkable that so soon after a recession the stock is enjoying new highs.  The Dow would have to gain 40% to make the same claim.

So some may ask whether Apple’s stock is getting ahead of itself.  Perhaps it’s showing signs of “irrational exuberance”.

This is not the case.  In fact, the stock is showing signs of irrational despondency.  This is demonstrated with the following graph.

Continue reading “Apple considered less valuable than the average S&P 500 company [Updated]”