AppleInsider | iPad component costs adjusted, estimated to cost Apple $260.
It looks like 50% gross margin across the product range is a good estimate.
Financial data and analysis
AppleInsider | iPad component costs adjusted, estimated to cost Apple $260.
It looks like 50% gross margin across the product range is a good estimate.
300k iPads on Day 1 vs. 270k iPhones in first weekend.
Closing in on ten weeks since Apple’s last report where they “cleared up” any confusion about accounting rules, most financial sites still show incorrect data on their profiles for Apple.
Out of the 14 major sites I looked at, just 5 have managed to update their historical financials with the retrospective amendments freely available from Apple’s Investor Relations site.
Deagol’s AAPL Model: Ten weeks later, AAPL numbers elude financial web sites.
What RIMM doesn’t say (and, as far as I can tell, no one else has noted) is that Apple has surpassed them in total smartphone revenues. This quarter RIMM reported sales of $4.1 billion in revenue for their whole company. Apple surpassed them, selling $4.6 billion worth of iPhones in Q4 2009 and, more recently, $5.6 billion in Q1 2010. Remember, the iPhone didn’t exist until mid 2007.i Phone sales have gone from zero to $5.6 billion in about 900 days. It’s very hard to compete against that explosive growth.
There are many, many things that Google could do, that we chose not to do… One day we had a conversation where we figured we could just try to predict the stock market. And then we decided it was illegal.
link: MacDailyNews
This is so insane that I have to assume he was mis-quoted.
 The Amazing Recovery: Here’s Everything That’s Happened Since The Dow’s March 9, 2009 Low
Erick Maronak, manager of the Victory Large Cap Growth Fund, says Apple is the best-run company in the U.S.
I would add it’s also almost the biggest and at the same time least understood. A lack of understanding is reflected in a high risk rating, which is itself shown in the company’s Beta.
All told, that makes Apple the fourth largest market cap in the US with the volatility and apparent risk of a startup.
Asymmetries of information don’t get better than this.
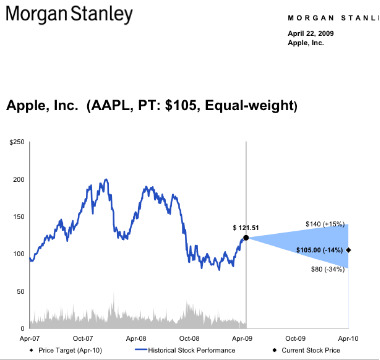
 10 months ago Ms. Huberty released her price target for April 2010 (see graph) at between $100 and $105. The stock was trading at $121 then and her forecast was for a 14% decline.
She wrote:
Investment Conclusion: The combination of a March quarter beat and positive management tone is likely to keep AAPL shares in its recent trading range. Valuation is not stretched by any means but at 21x our adjusted C09 EPS, the market already assigns AAPL a 16% premium to RIMM which credits AAPL for lower risk given its large cash balance and a more diversified revenue model. We remain Equal-weight AAPL shares.
We note that the stock is currently trading above $200 at a P/E of 19x. She had forecast a price of $100 on a P/E of 21x Calendar 2009 Earnings Per Share. The implication is that EPS would have been $100/21 or $4.7 for calendar 2009.
She already had one quarter of data ($1.79 for CQ1) therefore she forecast $4.7-$1.79 = $2.97 for the remainder of the 2009 calendar year.
In reality, Apple earned $10.24 for 2009 and $8.45 for CQ2 through CQ4. That makes her error ($8.45-$2.97)/$2.97 = 184%.
We see today that she has a new forecast for $225 a share which leads us to conclude that she still has a job.
 Of all the world’s companies, Apple ranks as the 11th most valuable. As a technology company its market capitalization is second only to Microsoft.
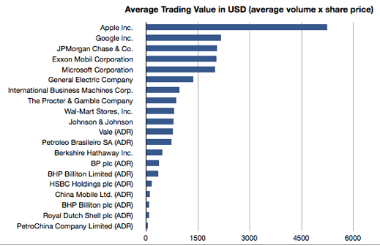
Of the top 20 largest companies, all of which are above $150 billion in market cap (listed in graph above), Apple has the highest volume of trading as measured by dollar value (average volume multiplied by last share price is $5.2 billion per day–see graph). In fact, it’s more than twice as popular as a traded equity than the next highest, Google and 2.6 times as popular among traders as Microsoft.
This trading volume might also be reflected in its beta (the correlation of price with the market with 1 meaning perfect correlation). Apple’s Beta is 1.59, nearly the highest of the super-large caps and the highest by far of the tech large caps.
Surely, this confirms that Apple is not only huge but hugely popular and highly visible among investors. Suggestions that its current discounted value is due to obscurity among IT buyers translating to obscurity among investors does not wash.
Source: Google Finance
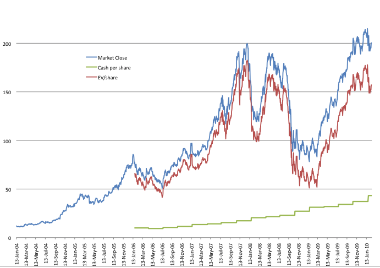
 On Christmas Eve 2007 to be precise. That’s when the Enterprise Value/share was $181.5. These days it’s around $150. The Enterprise Value (EV) measures the value of future cash flows excluding current assets and is a better indicator of the potential of a company than its current overall value.
As you can see in the graph above, the cash per share (in green) has grown to $43 while back in late 2007 it was less than half that. As a result, although the market value for Apple peaked at $215 on 19th January this year (the blue line), the EV/share was only about $178 (the red line), below the all-time-high in 2007.
As Apple’s cash continues to grow, the gap between EV and MV will also grow. If the MV remains low (as the P/E is indicating) then the Enterprise Value, i.e. the net present value value of future cash flows, drops.
Did Apple’s prospects peak in 2007–six months after the iPhone was first launched–or is the current valuation still a function of sentiment of the overall economy, independent of the company’s fundamentals?