Apple Fourth Quarter Estimates

As Philip Elmer-DeWitt is still interested in my estimates I provided the following:

Revenues ($B) 57.8
EPS ($) 14 (908m shares)
iPhone (units) 56.4 million
iPod (units) 7.6 million
Mac (units) 4.14 million
iPad (units) 26.5 million
iTunes/Software/Services ($) 4.2B
Accessories ($) 2.2B
GM% (percentage) 37.1%

I arrived at these estimates without looking at anyone else’s (except for Apple’s own published guidance). Soon after sending them I noticed that Daniel Tello published his own.

In the same format as above, I quote them for comparison. Please visit his post for additional detail.

Revenues ($B) 59.0
EPS ($) 14.92 (895m shares)
iPhone (units) 56 million
iPod (units) 9 million
Mac (units) 4.65 million
iPad (units) 25.5 million
iTunes/Software/Services ($) 4.3B
Accessories ($) 1.8B
GM% (percentage) 37.8%

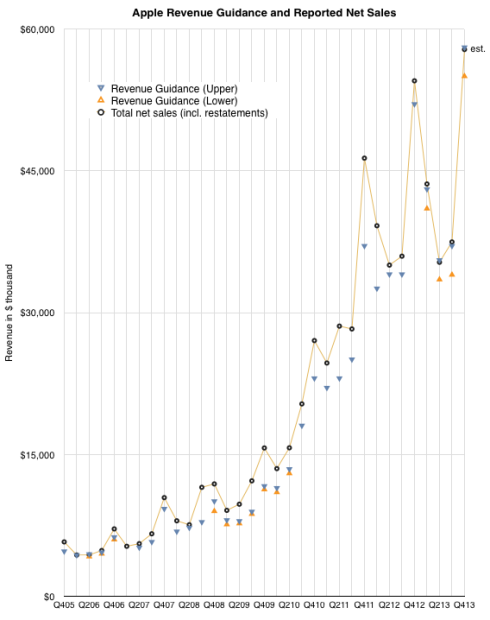
The graph below shows the history of revenue guidance vs. revenue reported. The last quarter shows my estimate for net sales.

Screen Shot 2014-01-15 at 1-15-4.06.58 PM

Note that the company achieved at or slightly above its upper guidance ever since they started offering a range for guidance (i.e. since Q1 2013). My estimate for sales is therefore very near the top of guidance. The figures for units earnings and margins all result from this assumption.

How many years does Apple have?

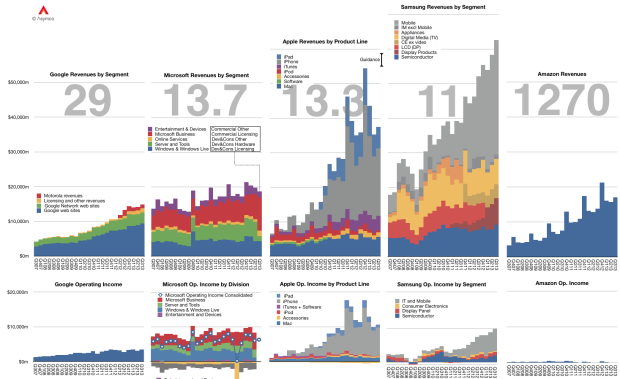
The graph below shows the Revenue and Operating Income for a select group of companies. The large numbers represent the share price to earnings (trailing twelve months) ratio (P/E or PE ratio).

Screen Shot 2013-11-06 at 11-6-2.56.25 PM

Of course the P/E ratio hides a lot of subtlety. It mostly fails to account for the fact that earnings are largely a matter of opinion. A company can defer income (as Apple and Microsoft do), it can invest earnings (as Amazon does) and can otherwise avoid declaring it since it’s taxable. Continue reading “How many years does Apple have?”

How many iOS devices will be produced in the next 12 months?

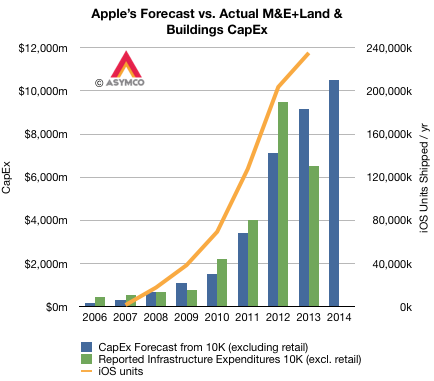
Apple’s capital expenditures for product tooling, manufacturing process equipment, corporate facilities and infrastructure has followed very closely their production of iOS devices. The pattern is shown in the graph below.

Screen Shot 2013-10-30 at 10-30-2.12.28 PM

Note that although reported expenditures did not match forecasts for 2012 and 2013, the differences nearly cancel each other.1 The company’s forecast for fiscal 2014 is shown as well.

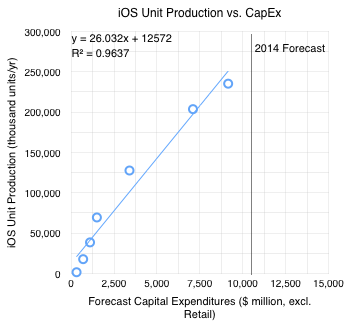
The orange line shows iOS unit production2 with the scale on the right-side axis. Note the correlation with forecasts on CapEx. The relationship can be seen more clearly in the following scatter plot.

Screen Shot 2013-10-30 at 10-30-2.33.26 PM

I added the 2014 Forecast ($10.5 billion from the latest 10-K filing). If the relationship holds into next year then the iOS unit shipments should be between 250 million and 285 million.3.

  1. I suspect that the difference might be caused by a payment being brought forward in 2012. []
  2. Technically, shipments []
  3. The equation for the trend line shown suggests 285,908,000 units []

iTunes users spending at the rate of $40/yr.

In the latest quarter the iTunes top line grew by 32%. Additional newly reported items:

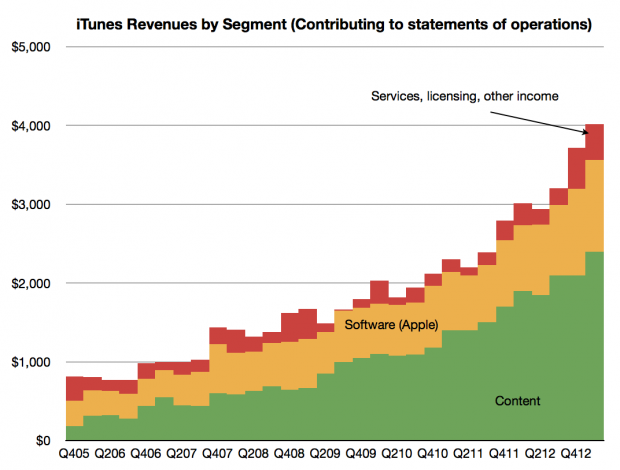
  • Quarterly revenues topped $4 billion (a new high) and the company suggests that this rate is maintainable by stating it has a “$16 billion annual run rate”. The pattern of revenues is shown below.

Screen Shot 2013-05-12 at 5-12-8.12.30 AM

  • The content portion of iTunes revenues was $2.4 billion, up from $2.1 billion sequentially. Growth into Q1 is not unusual as many holiday iTunes gift cards are redeemed during January.
  • Revenue growth has been surprisingly steady, averaging 29%/quarter for more than six years.

Continue reading “iTunes users spending at the rate of $40/yr.”

Margin call update: About those changes in service policies

In the March quarter, our gross margin was 37.5%. It was at the low end of our range. We had a few items that on balance resulted in us reporting at the low end. They included mix, in particular, selling more iPads than we had planned, including getting iPad mini into our four- to six-week channel inventory range, some changes in our service policies that required us to make provisions for prior quarter sales, and we had some unfavorable adjustments.

– Peter Oppenheimer, Apple CFO, FQ2 2013 Earnings Conference Call

[my emphasis]

Thanks to Philip Elmer DeWitt for bringing this quote to my attention in the comments to Margin Call 2.

I was curious about the “changes in service policies” and what that might have meant, especially since they seem to have been retroactive (provisions for prior quarter sales).

The 10Q offers more details:

Accruals for product warranty for the three months ended March 30, 2013 include $414 million associated with product sales in prior fiscal periods reflecting the impact of changes to certain of the Company’s service policies and other estimated warranty costs. Of this amount, $224 million is associated with product sales in the first quarter of 2013, and the remainder is associated with product sales in 2012.

– Apple 10Q, Note 6, Page 17, second paragraph.

Continue reading “Margin call update: About those changes in service policies”

Margin Call 2

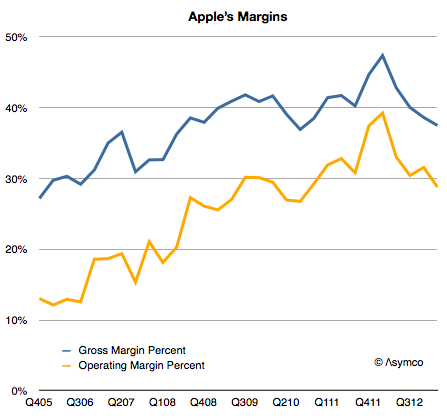
I expected Apple’s margins to improve  last quarter. They didn’t and so the question I needed to answer is why. Here is a history of Apple’s gross margin and operating margin as reported since late 2005:

Screen Shot 2013-04-25 at 4-25-9.26.53 AM

For a company selling hardware these are extraordinarily high margins. They are higher than those of Google and have narrowed the gap with Microsoft,  neither of which has a high proportion of hardware sales:

Continue reading “Margin Call 2”

The cost of building Galaxies (and iPhones)

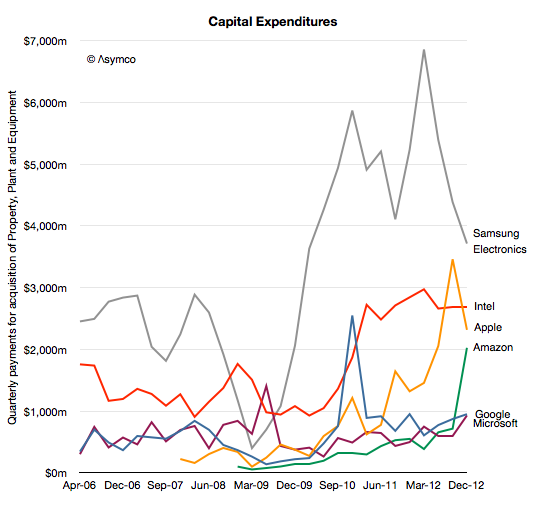
Although Samsung and Apple are acclaimed as the leaders in profit capture for smart (and otherwise) phones, what is not lauded is how much they spend on capital equipment used in the making of these phones.

In 2012 Samsung spent around $20 billion while Apple spent about $10 billion (excluding leasehold improvements or Apple stores but including real estate).

Compare these figures with Intel at $11 billion, Google at $3.2 billion, Microsoft about $2.8 billion and Amazon $3.8 billion (including presumably new distribution centers.)

Screen Shot 2013-04-04 at 4-4-5.51.15 PM

What each company spends on differs depending on its business model, but as the graph above shows it’s easy to see that there is a class of “big spenders” who spend so much that it makes it hard to imagine just what $10 billion/yr could actually buy.

To get an idea of just how big that figure is consider that Continue reading “The cost of building Galaxies (and iPhones)”

The cost of selling Galaxies, updated

Thanks to @jtk0621 via twitter I was able to obtain a quarterly view into Samsung’s SG&A expenditures by cost category.

The value of this data is in being able to understand why Samsung SG&A as a percent of sales remains fairly constant. To recap, the discrepancy with Samsung’s SG&A is that it has grown in proportion to rapidly rising sales. Normally, when sales grow, SG&A grows but when sales grow very rapidly, SG&A grows a bit more slowly since it’s primarily a function of headcount and hiring is necessarily organic and hence slower as a process.

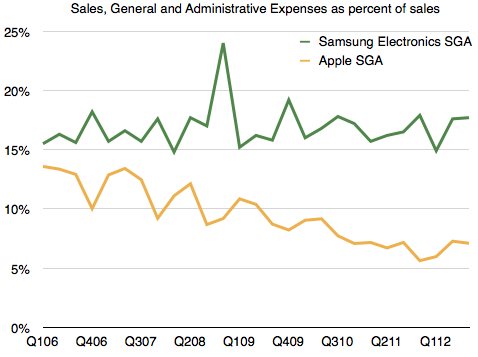
The contrast is shown in the following comparison between Apple’s SG&A and Samsung’s SG&A as a percent of sales. [For more detail on Samsung revenue composition see: The Cost of Selling Galaxies].
Screen Shot 2013-04-02 at 4-2-3.09.39 PM

Apple’s SG&A has declined as a percent of sales, as one would expect, but Samsung’s hasn’t.

I have hypothesized that the reason for this might be in the practice of “outsourcing” many marketing functions. As Samsung expands promotional efforts, it does so partially by hiring people but even more so by farming out a lot more work. In this way, if and when sales subside, it can pare costs. This practice ensures that it’s not exposed to a huge cost structure that is hard to control. The downside to this approach might be obtaining “quality” marketing as oversight is still depending on inside teams who still have limited resources.

To test this hypothesis, I looked at the types of costs it reports and divided them into two categories:

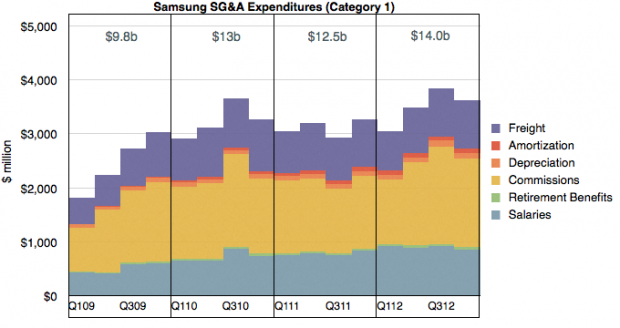
Category 1 are what might be considered “internal” costs which are in function of employees or operations. These costs are:

  • Salaries
  • Retirement Benefits
  • Commissions
  • Depreciation
  • Amortization
  • Freight

I graphed these costs over time below:
Screen Shot 2013-04-02 at 4-2-3.12.09 PM

Category 2 costs are those which can be “outsourced” and are in function of budget items. These are: Continue reading “The cost of selling Galaxies, updated”

iTunes Segment Revenues in Context

In the last few posts I estimated the iTunes economy in some detail. In absolute figures, the revenues and cost structures of iTunes are substantial:

  • 6.3 billion transactions in the last quarter
  • $4.6 billion consolidated revenues (including software & services)
  • $3.3 billion in content payments
  • $650 million in operating income

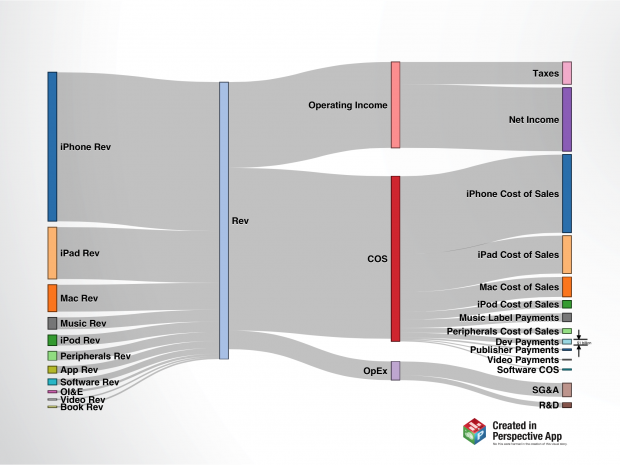
However, as a part of the entire Apple revenue model, iTunes appears to be a small contributor. The following diagrams shows where revenues came from and where they were spent during the last quarter

Sankey-Income1

A few notes: Continue reading “iTunes Segment Revenues in Context”

So long, break-even

The following is another excerpt from a report titled “iTunes Business Review” which will soon be available for purchase through the Asymco Store. If you are interested in the product please get in touch.

iTunes store will be 10 years old next month. From its inception Apple has stated that it aims to run the store “at break-even”.  The business has grown so rapidly however that its profit-free nature has come under severe pressure.

The reasoning goes that as more media types have been added costs have increased but revenues have increased even faster. Consider the estimated gross revenue base as shown below:

Screen Shot 2013-03-22 at 3-22-2.39.55 PM

What is known as iTunes today has quintupled in seven years. Although cost of content sales are likely to have been preserved as a ratio (about 30%) the vastness of transaction volume (estimated at 23 billion item transactions in 2012 alone) implies that there are some significant economies of scale.

This implies that the operating costs are spread more evenly and that therefore the possibility exists for some operating margin. Continue reading “So long, break-even”