The Conundrum of iTunes' Recognition of Revenues

An excerpt from a report titled “iTunes Business Review” which I’m currently writing:

Revenue Recognition

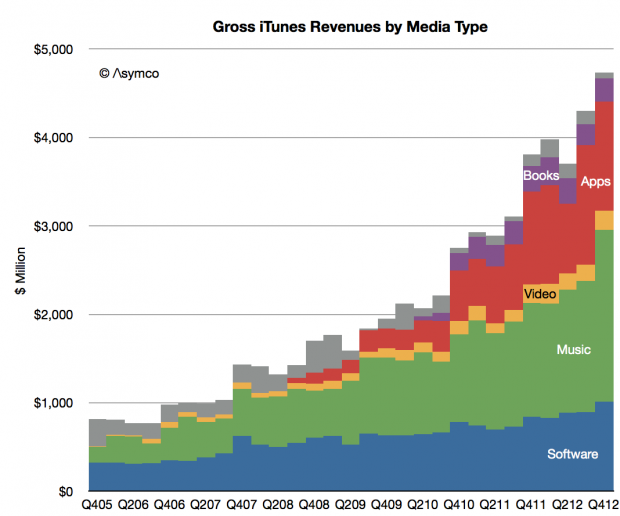
Before proceeding it’s also important to understand one more detail: The company does not report all transactions through iTunes as revenue. To quote the 2012 Annual Report (10 K):

For third-party applications sold through the App Store and Mac App Store and certain digital content sold through the iTunes Store, the Company does not determine the selling price of the products and is not the primary obligor to the customer. Therefore, the Company accounts for such sales on a net basis by recognizing in net sales only the commission it retains from each sale. The portion of the gross amount billed to customers that is remitted by the Company to third-party app developers and certain digital content owners is not reflected in the Company’s Consolidated Statements of Operations.

What this means is that App revenues are only reported at the 30% level that is retained by Apple. The 70% paid to developers is excluded from Apple’s financial reports. The same is true for other products for which it considers to be acting as an agent. The difference seems to be mostly in cases where Apple does not define the end user pricing. This is mostly true for ebooks however that may not be true for all book titles.

This distinction between “gross” revenues and “reported” revenues is maintained in this report but both are presented for consideration. Gross revenues are needed for comparing the media businesses against each other and for competitive assessment but reported revenues are needed to test assumptions against ground truth.

This can be explained with an example:

If a song sells for 99c then Apple reports all 99c as Revenue and then pays the record company about 70c and uses 30c to operate the store and pay for transaction costs. In the case of music it means the Gross Revenue is 99c and the Reported Revenue is also 99c.

However, if an app sells for 99c then Apple reports only about 30c as Revenue. It does not consider the portion paid to developers as revenues for itself. It spends a portion of the 30c to pay for transactions, hosting, and the time testing and accepting the apps. In the case of apps and books it means the Gross Revenue is 99c and the Reported Revenue is 30c.

So if Apple sells one song and one app then the Consolidated Gross Revenue is 2 x 99c or $1.98 but the Consolidated Reported Revenue is only $1.29 (99c + 30c).

The difference in accounting is sometimes called “agency” vs. “wholesale” and it applies in some retail businesses. Another term sometimes used for used goods is selling items “on consignment“.

The reasoning for why some media are treated one way or another is cited in the Annual report as “the Company does not determine the selling price of the products and is not the primary obligor to the customer”. In the case of Apps, the price is set by the developer and the developer is obligated to deliver on the promise. Apple acts as transaction processor and they don’t consider that they ever owned (and hence never sold) the app. Note that this accounting is probably discretionary. They decided to do it this way and it’s not clear that it was necessary to do it this way by any regulation.

This distinction between two treatments of revenue makes it difficult to understand the complete story behind iTunes.

If you’re interested in the full report, contact me directly.

UPDATE:

Apple’s rationale can be partly justified from a reading of a Financial Accounting Standards Board statement titled “Reporting Revenue Gross as a Principal versus Net as an Agent” (Emerging Issues Task Force Abstract EITF 99-19 http://www.fasb.org/pdf/abs99-19.pdf) a portion of which is quoted below.

“Indicators of Net Revenue Reporting

15. The supplier (not the company) is the primary obligor in the arrangement— Whether a supplier or a company is responsible for providing the product or service desired by a customer is a strong indicator of the company’s role in the transaction. If a supplier (and not the company) is responsible for fulfillment, including the acceptability of the product(s) or service(s) ordered or purchased by a customer, that fact may indicate that the company does not have risks and rewards as principal in the transaction and that it should record revenue net based on the amount retained (that is, the amount billed to the customer less the amount paid to a supplier). Representations (written or otherwise) made by a company during marketing and the terms of the sales contract generally will provide evidence as to a customer’s understanding of whether the company or the supplier is responsible for fulfilling the ordered product or service.

 

Tim Cook's comments on Apple Stores, illustrated

Yesterday Tim Cook spoke at the the 2013 Goldman Sachs conference:

There’s no better place to discover, explore and learn about our products than in retail. It’s the retail experience where you walk in and you instantly realize this store is not here for the purpose of selling. It’s here for the purpose of serving. I’m not even sure “store” is the right word anymore. They’ve taken on a role much broader than that. They are the face of Apple for almost all of our customers

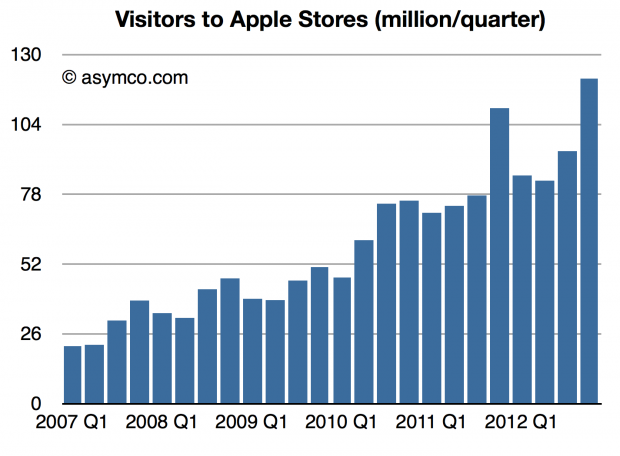
Last quarter, we welcomed 120 million people in our stores.

Screen Shot 2013-02-13 at 2-13-1.46.24 PM

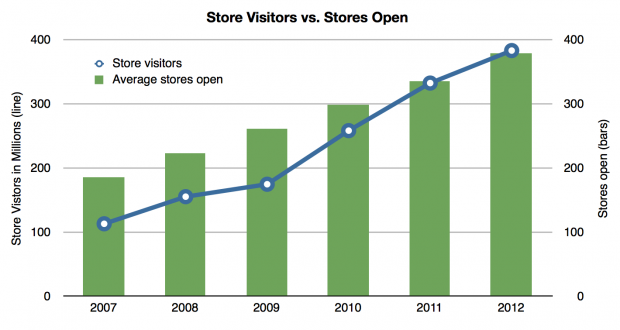
We only have a little over 400 [stores]. Last year, we welcomed 370 million into the stores.

Screen Shot 2013-02-13 at 2-13-12.51.57 PM

We’re closing 20 of our stores and moving them and making them larger this year. And in addition to that 20, we’re adding 30 more. Those 30 will be disproportionally outside the U.S. That gets us in 13 countries. Continue reading “Tim Cook's comments on Apple Stores, illustrated”

Counting stool legs

As Apple introduced a new set of revenue categories, the performance of its “minor” businesses has become clearer. The changes include re-statement of what used to be called “Software” revenues as part of iTunes. Apple Software includes sales of OS X, iWork and its pro tools. These products are now sold through the Mac App and since that is a part of iTunes its inclusion makes sense.

However, we have to understand that iTunes now is a blend of many business models. Some, like music, use a wholesale revenue recognition method and have very low to zero margins, others, like eBooks and Apps, are sold using an “agency” revenue model with potentially higher margins and some, like Software, are recognized at full value with very high margins.

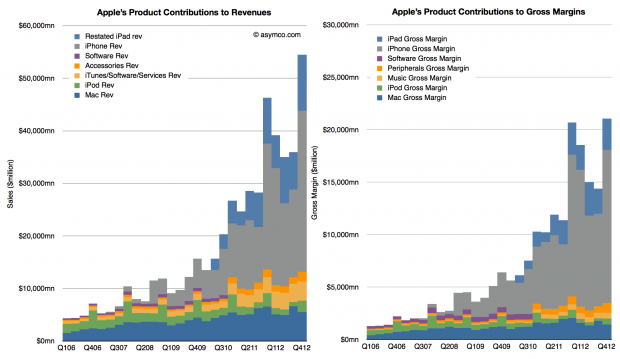
When re-stated this way, iTunes becomes much more than a “break-even” business. My own estimate for its gross margin as currently reported is between 15% and 17% but it could be even higher. This allows the following picture to emerge:

Screen Shot 2013-02-11 at 2-11-12.06.08 PMThese graphs show contributions to Revenue and Gross Margins of the various reported product categories. Note that restatements for Accessories and iTunes only extend back to Q4 2010 and the older “Software” is still shown for earlier periods.

Note also that Accessories are now including some of the revenue that used to be reported as part of iPad and iPhone revenues. This was discussed in more detail here.

There are several observations we can make: Continue reading “Counting stool legs”

Margin Call

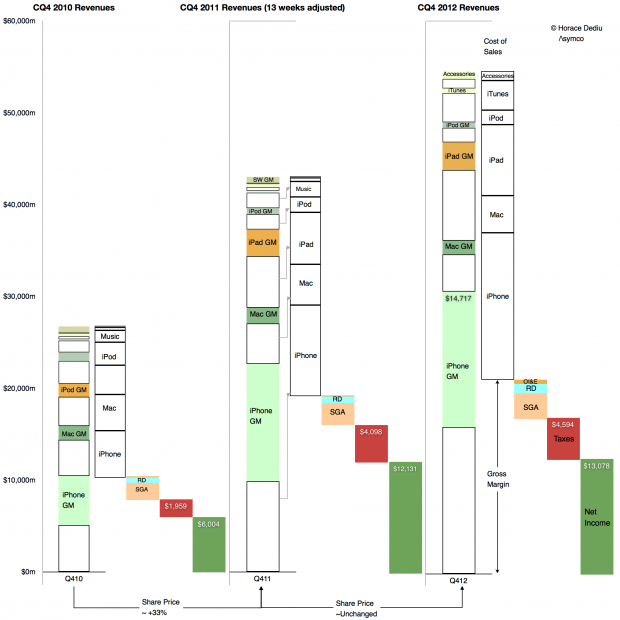
During the fourth quarter 2012 Apple’s margin fell to about 38%, a level not seen since two years earlier and down from a peak of 47% in Q1 2012. Does this lower margin foretell lower prices or a loss of competitiveness?

Obviously not.

Gross margin is a function of Sales (aka revenues) and Cost of Sales. Gross margin as a percent is calculated with the following formula: (Sales-Cost of Sales)/Sales. If dealing with a single product, Sales itself is the product of shipments and price/unit but since cost of sales is also a product of shipments and cost per unit, the shipments numbers cancel each other out and the gross margin reduces to the ratio of (Price-Cost)/Price.

So a margin drop can only be caused if one of three things happened:

  1. Prices dropped
  2. Costs increased
  3. Both prices dropped and costs increased.

We can easily find out which of these was the cause in the fourth quarter because we have volumes and prices for all of Apple’s products. We can also derive total costs based a total gross margin. These are illustrated in the following retina-friendly diagram.

Screen Shot 2013-02-05 at 2-5-11.25.16 AM

Continue reading “Margin Call”

Apple's Calendar Fourth Quarter 2012 Growth Scorecard

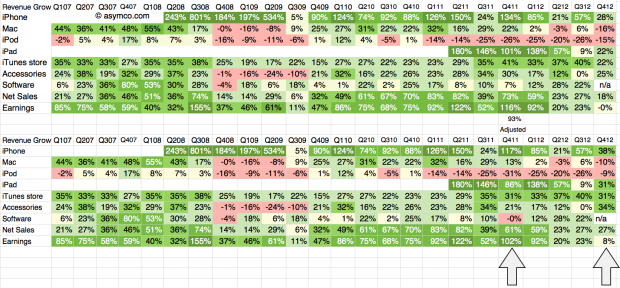
The fourth quarter of 2012 was 13 weeks in duration while the fourth quarter of 2011 was 14 weeks. The difference implies that a comparison of revenues should be done with an adjusted 93% of the 2011 values. The growth for 4Q 2011 relative to 4Q 2010 should also be adjusted on this basis.

The following tables show the unadjusted and adjusted growth rates. The adjustments apply to the bottom table and the columns highlighted.

Screen Shot 2013-02-04 at 2-4-7.19.18 PM

As in previous scorecards, I used the following color scheme to “grade” the performance. Continue reading “Apple's Calendar Fourth Quarter 2012 Growth Scorecard”

Estimates for Apple’s first fiscal 2013 quarter

I’ve postponed my estimates for the fourth calendar for a long time. The reason is that there have been conflicting data to deal with and I’ve been hoping for some clues to give clarity. Unfortunately, even though I waited, I have not received many clues. Here are the challenges we have to deal with in this quarter:

  1. Management gave very low guidance for the quarter’s earnings and sales. Normally this should not be a concern since the long-term pattern has been for them to “sandbag” significantly. For example last year’s fourth quarter was guided at $9.3 EPS while the company delivered $13.87, a 49% “beat” to their guidance. However Q2 and Q3 beats were only 7% and 13% respectively and if we assume a similar number (10%) for Q4 we get about $13/share which would be a year-on-year decline in earnings (down from $13.9). This has not happened for many, many years. Management explained this through a lengthy set of reasons including a shorter quarter (13 weeks vs. 14 weeks), new product launches, currency fluctuations, deferrals and unfavorable component pricing. Then again, similar explanations were used in the past with no reflection in what actually happened.
  2. Management also launched a large number of new products. This normally leads to a surge in sales. In fact, 80% of revenues would come from a new portfolio of products. Having such a broad launch quarter into a holiday, would normally imply huge growth. Not only is this a critical launch quarter for many products but they also rolled out the iPhone to more markets more quickly than ever: 100 countries in three months. The broad roll-out implies a steeper ramp in production and thus more volumes. This would also contradict the lowered expectations from the CFO. However… Continue reading “Estimates for Apple’s first fiscal 2013 quarter”

Samsung Electronics Segment Revenues and Operating Income in Context

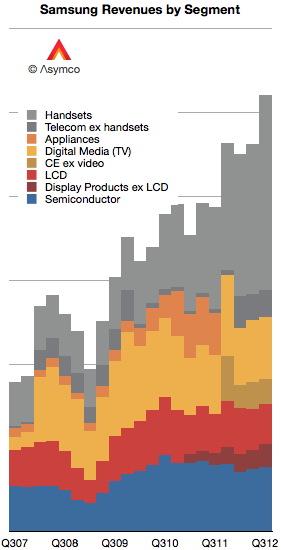
As first introduced last week, Samsung’s revenues have grown primarily due to the expanding volumes of smartphones. In today’s post I convert the revenues and operating incomes to US Dollars and compare them to a set of companies.

First, I should note that Samsung has changed both the designation of its divisions and the way it reports revenue. Broadly speaking, Samsung Electronics has four major divisions:

  1. Semiconductors. This includes memory products as well as systems such as CPUs.
  2. Display products. This used to be called “LCD” but has been re-named Display Products.
  3. Telecom. This is mainly mobile phones but includes additional products and services for telecom operators and PCs. The division has recently been re-named IM (IT and Mobile communications).
  4. Consumer Electronics. This group has changed names from Digital Media and Appliances to CE. The majority of sales value comes from televisions but also includes consumer electronics and appliances.

The company further combines Semiconductors and Display Products into a group called DS (Device Solutions) and Consumer Electronics and IM into DMC (Digital Media & Communications).

I tried to reconcile these various nomenclatures with color coding in the following graph. Semiconductors are blue, Display components are red, Consumer Electronics are Yellow and Mobile are grey.

Each gridline represents $10 billion.

Continue reading “Samsung Electronics Segment Revenues and Operating Income in Context”

The cost of selling Galaxies

In the post “Google vs. Samsung” I compared the profits of Google and Samsung Electronics’ mobile (aka Telecoms) division. It showed how Samsung has grown its mobile business to such a degree that, if sustained, could conceivably influence the way Android is controlled.

However, we should not analyze Samsung’s mobile group in isolation of the entire company. Samsung relies on internal transfer of technology and capacities of production which are quite unique for device vendors today. In other words, Samsung is a relatively integrated enterprise. Understanding the whole is necessary before understanding the part.

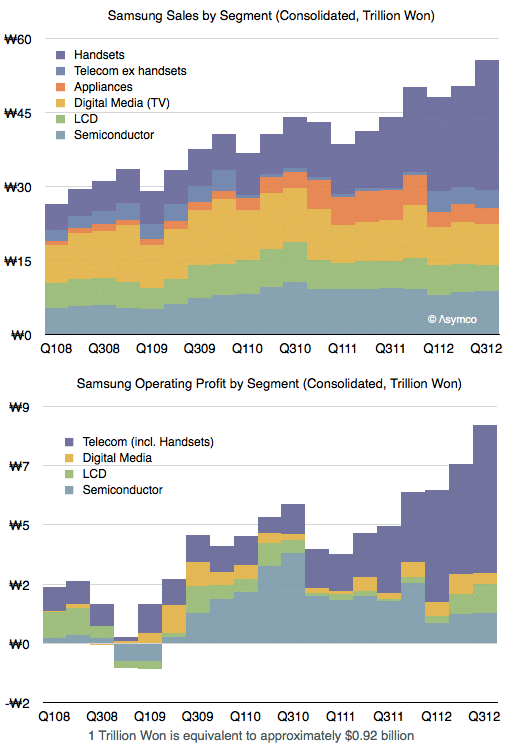
The following graph shows the sales and operating profit for  Samsung Electronics as a composite of its divisions since early 2008.

As one would expect, the mobile group (Telecom) is the source of both top and bottom line growth. The group has also been leading in terms of margins and increasing those margins steadily.  Continue reading “The cost of selling Galaxies”

The cost of mobile clicks

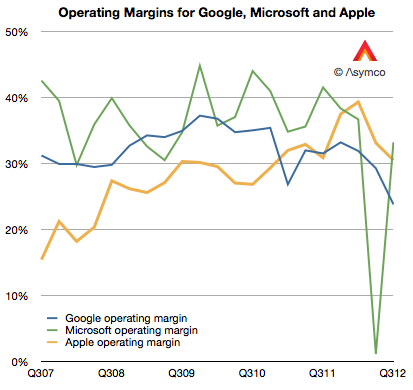
Google’s operating margins fell to 23.7% last quarter. This level is the lowest I’m aware of. From 2007 to late 2009 margin went from about 31% to about 37%.  Then from early 2010 until present they fell. The history is shown the the following graph.

[I included Microsoft and Apple operating margins for comparison.]

Some of the recent decline is due to the inclusion of Motorola into consolidated earnings. Motorola gross margins were therefore 18%. Excluding Motorola, Google gross margins (Revenues-Cost of Revenues) were 61.5% of revenues.  However, even excluding Motorola, Google’s core margins dropped. Continue reading “The cost of mobile clicks”

On not being boring: A dramatic reading of Apple's share price

Apple’s renaissance began with the iPod. This was not evident right away however. The product was unveiled on October 23, 2001 at a time when Apple’s share price had just fallen 70% from year-earlier levels. It was perhaps a good point from which one could expect a recovery to begin.

It was not to be. One year after the iPod’s launch the stock price had fallen another 20%. Indeed during 2001 the company was in the throes of a “bear market” in its shares. If we measure a time of persistent share price reduction as a bear market, then the one in 2001 was significant. For 154 days, between April 27 and September 28, 2001 the shares fell 38%. This represents the first bar in the following graph showing all the Apple bear markets since then.

I also illustrated these bear markets in terms of their duration and the average %drop/day.

Chronicling these periods: Continue reading “On not being boring: A dramatic reading of Apple's share price”