What did I get right and wrong about the first quarter?

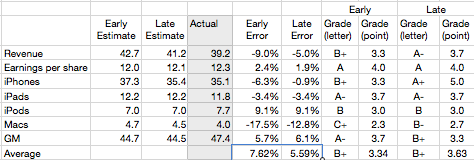
I analyze my performance every quarter to see if there is any pattern of error in my analysis. I devised a scoring method analogous to the grade point average system used in most US schools. You can read about the fourth quarter here.

This quarter I made one public release of data here and a semi-public update on the iPhone shipments here.

The resulting scores for both early and late estimates are shown in the table below:


Continue reading “What did I get right and wrong about the first quarter?”

Google and Microsoft speak volumes with silence

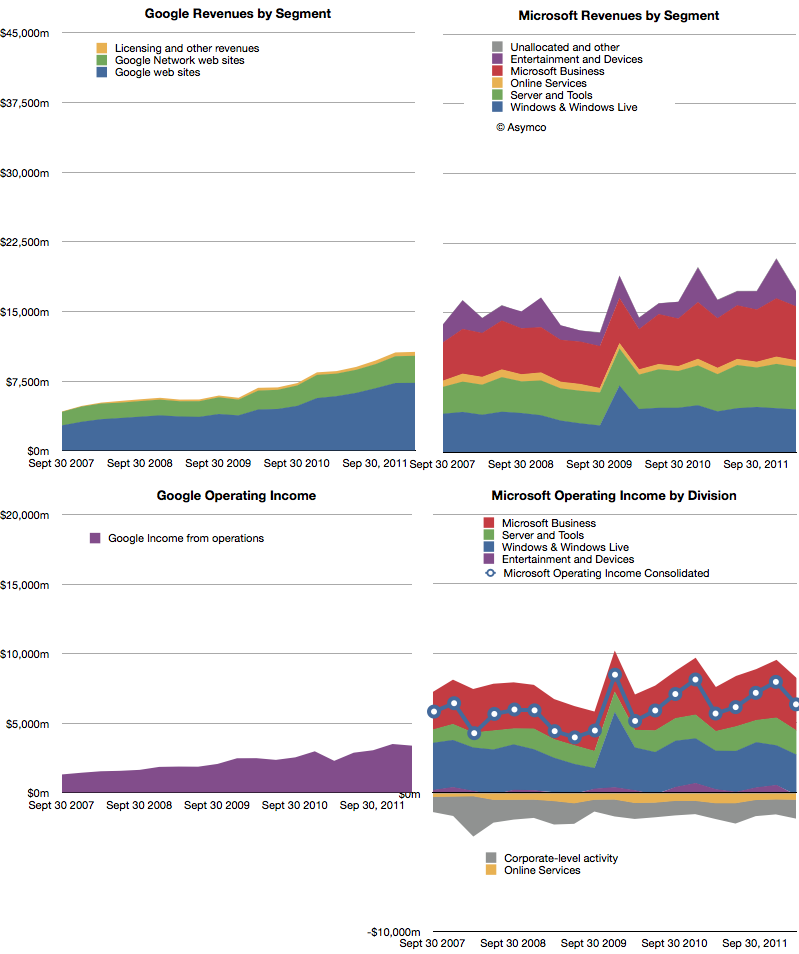
The following charts show Google and Microsoft revenues and operating income:

Both companies showed healthy growth. Revenues: Microsoft 6%, Google 24%. Operating Income: Microsoft 12%, Google 48%. Google had a particularly weak margin Q1 2011 so its income growth appears very strong.

The surprise in Microsoft’s performance was Continue reading “Google and Microsoft speak volumes with silence”

Did the dividend decision affect Apple's share price?

One of the arguments made for the cause of the increase in Apple’s share price of late has been that dividends would attract more institutional investors and provide more liquidity to Apple’s shares. Can we test this argument?

We’re not dealing with speculation. The decision to start paying dividends was made three weeks ago. It makes sense to assume that this new information has been absorbed by the  markets and market participants have adjusted their positions. Funds that were previously restricted in their investment in Apple due to its lack of dividend policy, could now go ahead.

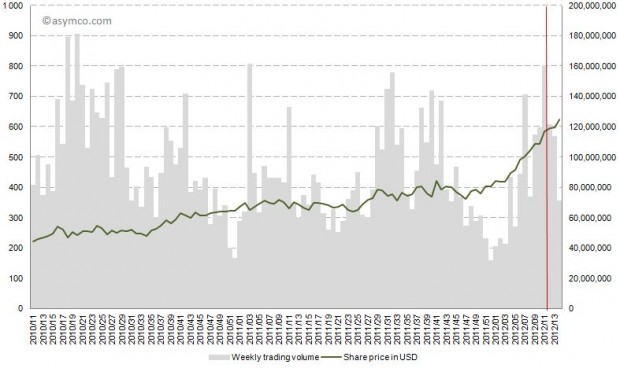
However, as the following chart shows, the share price climbed continuously before and after the dividend declaration of March 19th (shown in red). Trading patterns did not show unusual highs or lows. In fact, after March 19th the trading volume decreased on a weekly basis.

The other indicator is institutional holdings. Continue reading “Did the dividend decision affect Apple's share price?”

The role of capital [1]

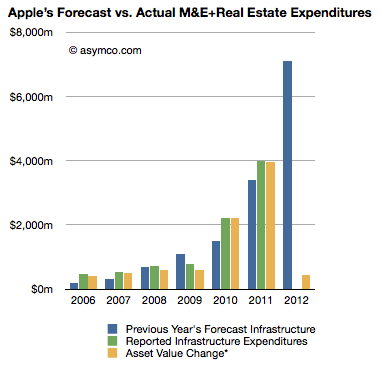
At the end of 2011 Apple’s net property, plant and equipment (PP&E) was $7.8 billion. This reflects $12.34 billion gross PP&E net accumulated depreciation and amortization of $4.5 billion. The depreciation and amortization increased by a total of $533 million and the gross PP&E increased by only $572 million. I say “only” because in the previous quarter PP&E increased by $1.42 billion. If we assume that this growth is equivalent to capital expenditures for the quarter, it’s also a very small amount given the company’s stated intentions to spend $7.1 billion during the fiscal year.

The gap is illustrated in the following chart:

Continue reading “The role of capital [1]”

Apple at $600. Who knew?

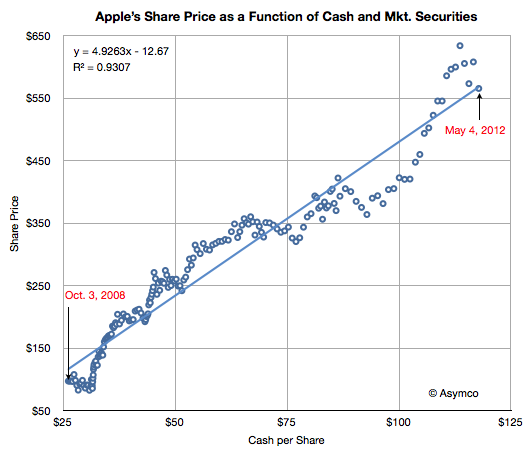
Apple’s share price has increased rapidly in the last few weeks. The rise to $600 was swift and broke the pattern of slow growth the the stock was able to obtain over the past few years. The level, however, shouldn’t have been a complete surprise.

I think Apple is going to $600…It’s really not that complicated. Apple has a number of key drivers in its business model which have yet to be properly priced into the stock because I think it’s very cheap at this level.

-Stephen Coleman, chief investment officer at Daedalus Capital

This prediction was made October 26, 2007. On that date Apple’s share price closed at $184.7. It may have seemed like a bold bet, but as Coleman noted, the reason why it would reach $600 was easy to spot.

The real story on how I get to that valuation doesn’t even involve the sale of (the Leopard operating system) or the growth in the Mac business. How I get there is through the iPhone itself.

What was not easy to tell was when it would reach $600. Continue reading “Apple at $600. Who knew?”

Estimates for Apple's second fiscal 2012 quarter

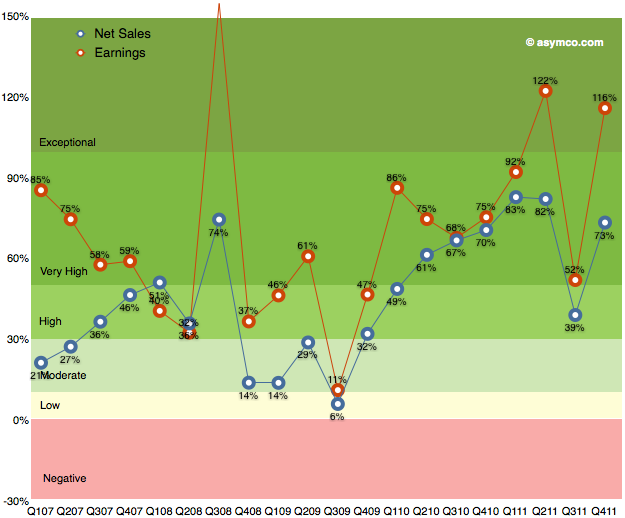
As the chart below shows, the last quarter (fourth calendar 2011, first fiscal 2012) was robust with 116% earnings growth and 73% net sales growth. I’ve heard many superlatives used to describe it. It is certainly exceptional but it was not as good as the second calendar quarter of 2011.

Sales grew faster both in CQ1 and CQ2 of 2011 and earnings grew faster in CQ2. It was in many ways a return to normality due to the iPhone returning to 133% revenue growth after the lull of the transitional third quarter.

Now it’s time to consider the current quarter. Continue reading “Estimates for Apple's second fiscal 2012 quarter”

Tim Cook's latest promise to Apple's employees

In the recent event discussing Apple’s cash plans, Tim Cook stated that the primary objective of the stock repurchase program is to reduce dilution from the ongoing distribution of shares to Apple’s employees and executives as part of their future compensation.

The amount allocated to this is $10 billion over a three year period.

This sets up an interesting analysis. The company is saying that they will continue to pay employees with newly issued shares (in addition to wages) but that a portion of those shares will be purchased back from the market to reduce dilution.

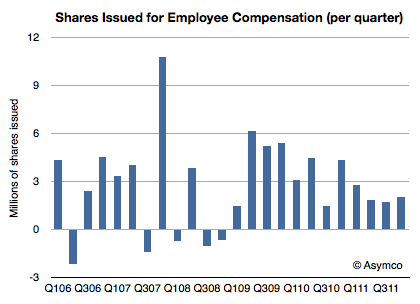
To understand the impact, it would make sense to look back and observe how many shares were issued in this way historically and consider how much $10 billion buys.

The following chart shows the quarterly change in shares outstanding.

Continue reading “Tim Cook's latest promise to Apple's employees”

Apple's dividend and share re-purchase plan: the impact on cash growth

Today Apple announced both a dividend and a share re-purchase plan which, when combined, will consume 45% of Apple’s current US cash reserves.

The dividend will be $2.65/share/quarter and the buyback will cost $10 billion over three years. The dividend will therefore cost about $2.5 billion per quarter (starting next quarter) and the re-purchase will cost about $833 million per quarter (starting next fiscal year).

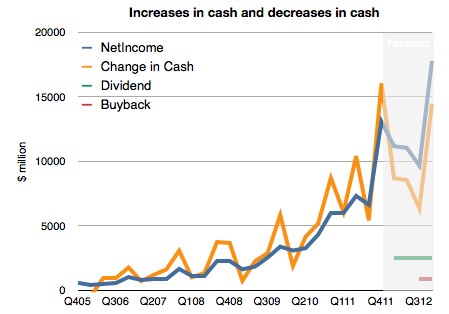
However, note that Apple’s cash has been growing far more quickly. It increased by $16 billion last quarter or $37 billion over the last year. This rate of increase is itself increasing.

To illustrate, I prepared the following chart. It shows historic net income, change in cash and a forecast of the costs of the new uses of cash and future net income (based on my estimates).

Continue reading “Apple's dividend and share re-purchase plan: the impact on cash growth”

The value of the OS X monopoly

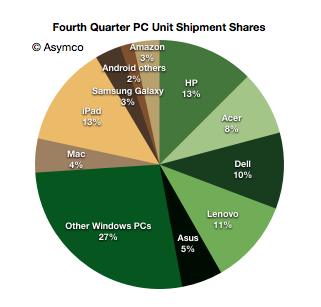
In January I noted that there were more iPads sold by Apple than PCs from HP, the largest PC vendor in the fourth quarter. Including all tablets, this is the distribution of market shares by units shipped.

Note the different color palettes for Windows and non-Windows.

By the metric of tablets+PC’s Apple appears to be the leading vendor. However, if we consider only the Mac, Apple is still well behind. The historic unit volumes of the two is shown below: Continue reading “The value of the OS X monopoly”

iPhone sine qua non

Last week I made an attempt to measure the iPhone’s manufacturing cost given new data points from the Foxconn field trip. The post generated a great amount of new knowledge and the feedback was very valuable.

The main value to me came from stepping back and looking at the entire cost and value structure for the iPhone. Putting costs into perspective is as valuable as knowing what they are.

The following diagram shows my estimates for this cost structure for the fourth quarter given both bill of materials estimates and the other parts of the cost of goods sold and operational expenses and even ancillary sources of revenue.

Source for BOM estimate: iSupply.

There are several observations easily made from this view: Continue reading “iPhone sine qua non”