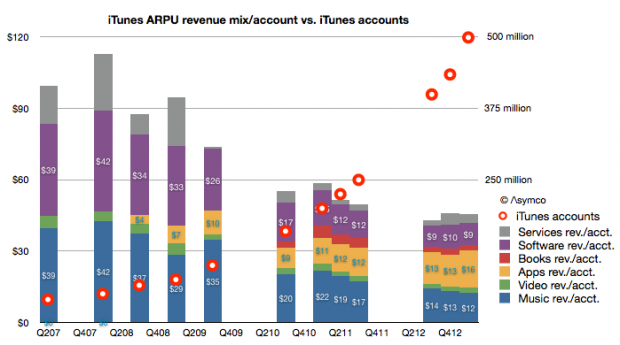
iTunes users spending at the rate of $40/yr.

In the latest quarter the iTunes top line grew by 32%. Additional newly reported items:

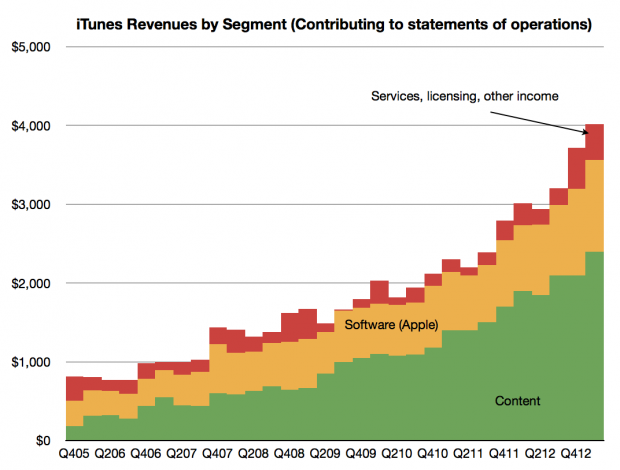
  • Quarterly revenues topped $4 billion (a new high) and the company suggests that this rate is maintainable by stating it has a “$16 billion annual run rate”. The pattern of revenues is shown below.

Screen Shot 2013-05-12 at 5-12-8.12.30 AM

  • The content portion of iTunes revenues was $2.4 billion, up from $2.1 billion sequentially. Growth into Q1 is not unusual as many holiday iTunes gift cards are redeemed during January.
  • Revenue growth has been surprisingly steady, averaging 29%/quarter for more than six years.

Continue reading “iTunes users spending at the rate of $40/yr.”

Measuring Platform Churn

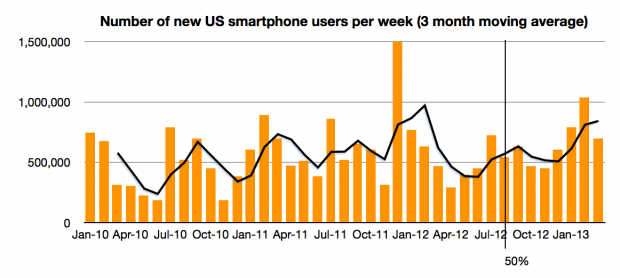
The latest comScore data shows consistent growth in US smartphone penetration. The rate is now 58.4% of adult consumers who own phones. This is up from 20% only three years ago. The rate of growth remains a remarkable 1.2% per month. That’s 700,000 new-to-smartphone users every week. The historic average over 3 years has been 1.07%/month This after having crossed over 50% on schedule in August 2012. There appears to be no slowing.

Screen Shot 2013-05-06 at 5-6-5.42.50 AM

The next milestone I have pencilled in is the 80% mark which I extrapolate to be achieved by October 2014. 80% could be considered “saturation” which would signify a rapid slowing of new user addition. However, that might still not happen until 100%, depending on the availability (or lack thereof) of non-smartphones to buy.

Continue reading “Measuring Platform Churn”

Surface Tension: The effect of Surface on Windows revenues

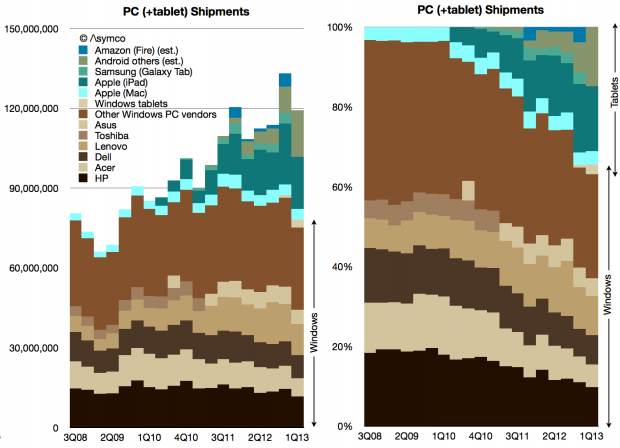
According to Strategy Analytics 3 million Windows-based tablets shipped in Q1. That is not inconsequential. It would add 4% to the total Windows-based computers and reduce the decline in Windows PC growth to -8% (from -11%). You can see the effect of those units on share in the following graphs.

Screen Shot 2013-05-02 at 5-2-2.06.21 AM

Continue reading “Surface Tension: The effect of Surface on Windows revenues”

Happy Birthday iTunes Store

iTunes (including software and services) revenues in Q1 topped $4 billion and were 30% higher than (re-stated) 2012 Q1 revenues. Accompanying this revenue figure were additional data points from the company:

  • Cumulative app downloads have surpassed 45 billion
  • Payments to developers reached a cumulative total of $9 billion
  • Payments to developers were $4.5 billion in most recent four quarters
  • Now paying $1 billion to developers every quarter
  • 800 apps are downloaded every second
  • iOS app revenues doubled since year-ago quarter
  • App Store accounted for 74% of all app sales in the quarter (citing Canalys)
  • App stores reach customers in 155 countries (850k Apps, 350k iPad apps)
  • iTunes music downloads are available in 119 countries (35 million songs)
  • Movies are sold in 109 countries (60k titles)
  • iBookstore is available in 155 countries (1.75 million titles)

This data allows for a few inferences: Continue reading “Happy Birthday iTunes Store”

Margin Call 2

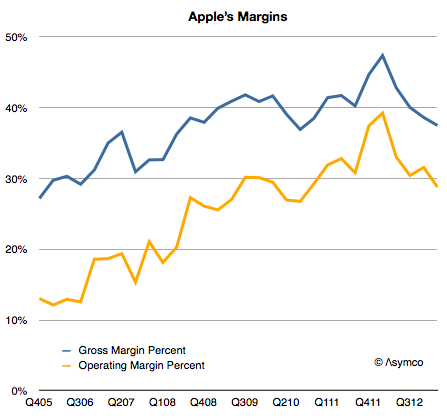
I expected Apple’s margins to improve  last quarter. They didn’t and so the question I needed to answer is why. Here is a history of Apple’s gross margin and operating margin as reported since late 2005:

Screen Shot 2013-04-25 at 4-25-9.26.53 AM

For a company selling hardware these are extraordinarily high margins. They are higher than those of Google and have narrowed the gap with Microsoft,  neither of which has a high proportion of hardware sales:

Continue reading “Margin Call 2”

The job the iPhone is hired to do, part II

I repeat what I’ve mentioned before: The iPhone is primarily hired as a premium network service salesman. It receives a “commission” for selling a premium service in the form of a premium price. Because it’s so good at it, the premium is quite high.

The job the iPhone is hired to do 

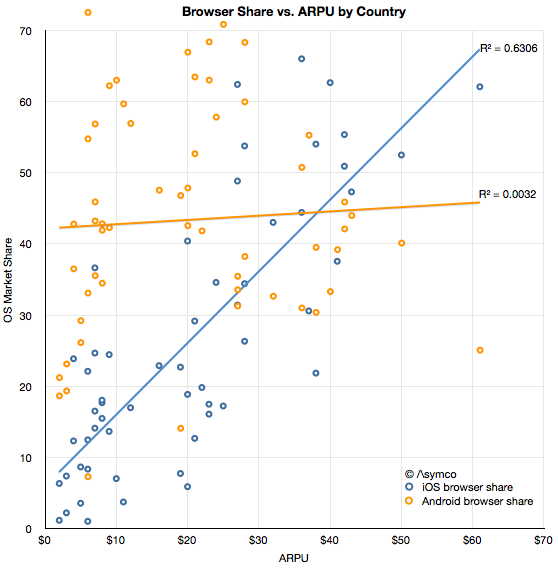
The original post on the hiring of the iPhone by operators was anchored in data about the revenue per unit (or price) that the product was able to obtain. The remarkable resilience in the exceptionally high average price showed that the iPhone was still getting a premium for moving users to higher levels of spending on network services.

The evidence was circumstantial however: By knowing the price and knowing it was far higher than competing products and knowing that much of it was paid by the operator and not the consumer (at least not up-front) implied that it was the iPhone, and only the iPhone, that was hired as a network service sales tool.

Now we have more evidence thanks to Ben Thompson (@monkbent). I illustrate the data here as an x-y scatterplot.

Screen Shot 2013-04-23 at 4-23-11.21.37 AM

Continue reading “The job the iPhone is hired to do, part II”

Interview with Chosun Daily of Korea about Apple

The following interview took place by email on April 15th, 2013.

1. What are the truth and false about the ‘Apple shock’ currently? In what perspective should we see this?

First, I’d point out that during Steve Jobs’ time the company suffered many such shocks. The stock fell many times far further than it just did for trivial and irrational reasons. Recently Warren Buffett himself pointed out that his own company had 50% drops in value four times in the past. Share prices are not always good indicators of potential and markets are not always efficient. I catalogued the dramatic share price declines in Apple during the last decade here.

Second, I’d point out that the number of people watching and commenting on Apple has grown almost as fast as its sales and earnings. When Apple was small the people who studied Apple were few. (You could see this today for other, modest tech companies. There aren’t 50 analysts writing reports every day and 2000 bloggers tweeting about Lenovo even though it’s a successful and growing PC company.) Because of this growth, I would guess 80% of the observers have not observed Apple’s prior painful episodes first hand. For them this is the first time a “dominant” Apple has slowed. The amplification of so many voices raising alarm makes it seem truer, but it isn’t.

Third, the failures being cited are not significant. In terms of increased competition, before Samsung there was Nokia and Motorola and the mobile Operators and Microsoft and Dell and many others long forgotten. They were all about to “defeat” Apple. As a quick example when Apple was “the iPod company,” iTunes was considered vulnerable and fragile due to DRM concerns or the Beatles not being on it. Microsoft was launching “Plays for Sure” and Zune and Creative was suing Apple over patents. These battles are long forgotten. Before those there were concerns about the viability of the Mac that go back decades. At the time those were actually very valid concerns. At the time Apple did not have half a billion users. It depended on one product. But what saved them was a process of development of new products not the products themselves. iPod faded, Mac faded. What mattered is that they created new things to replace them.

Finally, what is not commonly understood is that the mechanism for creating things at Apple is unchanged. Its functional organization is inherently unstable and chaotic, sometimes looking like it will derail. But that’s the way it was designed to be. You just have to have faith that it’s a system that works. Those who did in the past were well rewarded.

2. What possibilities out of 1~10, do you think, Apple will suffer the same downfall as Steve jobs has left the company in the past in current?

Continue reading “Interview with Chosun Daily of Korea about Apple”

Lumia: Is the light visible?

The following graph shows the history of smartphone volume shipments from Nokia.

Screen Shot 2013-04-18 at 4-18-1.48.21 PM


Lumia sales have increased to 5.6 million units last quarter. Up from 4.4 during the previous quarter. Symbian devices have nearly disappeared from the market with only 0.5 million shipped.

This puts an end to Symbian sales after over a decade since sales start and two years after it was declared that sales would end.

The bad news remains that smart devices as defined by Nokia are still not profitable. If volumes grow it’s possible that the cost structure (without further cuts) can be sustained and perhaps the business will get its footing.

The level of 6 million units/quarter is about where HTC and RIM are today but only half of what ZTE and Huawei are probably shipping. As a hardware business it might work, barely. It certainly helps to have $250 million as platform support payments from Microsoft.

As a platform it’s still a very long haul for Windows Phone. Even if we assume a nominal $15 revenue/ Windows Phone license and ignore the kickback, at this level of sales the platform generates less income than what Microsoft gets from licensing IP to Android vendors.

Escaping PCs

The Windows PC market is contracting. The market data has been showing unit shipment declining for some time with the latest quarter having perhaps the steepest decline for two decades.

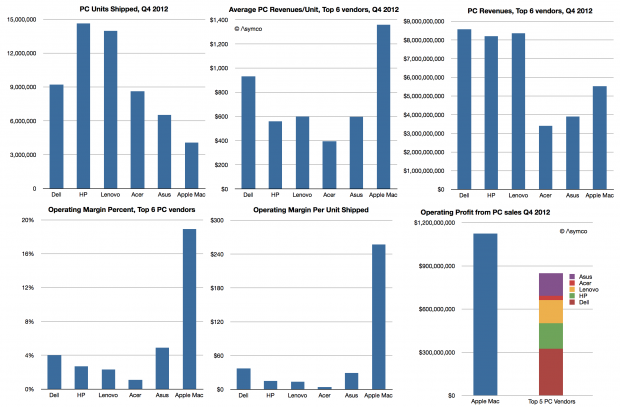
What remains undocumented however is how the market looks when considering economic value. A more complete picture would be to show revenues, average selling price (or revenue/unit), operating margins/unit and percent of profit capture.

The data is not beyond reach however. It involves combining the shipment estimates from e.g. Gartner with financial reports from the companies themselves. Some analysis is required to estimate margins but they are also not hard to obtain (e.g. from third parties.)

So here is a view of the market for the fourth quarter 2012:

Screen Shot 2013-04-16 at 4-16-4.05.57 PM

Continue reading “Escaping PCs”

Happy Birthday iPad

The latest data on PC shipments from Gartner showed a decline of  11.1% from the first quarter of 2012. As we don’t yet have the final data on Apple’s Mac shipments, I used my estimate of 4.38 million units (14% growth as per NPD estimate for the US) to obtain an estimate of Windows PC shipments.

That number is 74.8 million units. In the first quarter of 2012 the corresponding calculation yields 85.1 million units. That makes Windows PC rate of decline -12%.

The historic shipment data and growth rates are shown below:

Screen Shot 2013-04-11 at 4-11-6.07.30 AM


Note that tablet data is not yet included in the shipments summary. Windows shipments are shown in shades of Brown and tablets in shades of Blue/Green.

The decline in PC shipments is persisting and even accelerating.

Coming only a week after the iPad’s launch birthday, it’s perhaps a fitting testament to its impact.