What's up with text messaging?

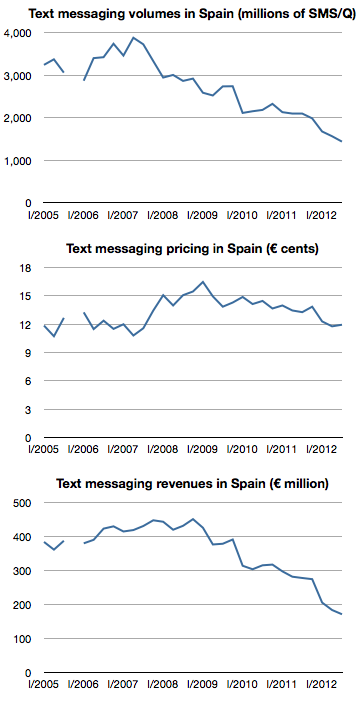
The following graphs show text messaging volumes, pricing and revenues for SMS in Spain.

Screen Shot 2013-01-18 at 1-18-2.40.39 PM

After peaking at the end of 2008 at about €450/quarter, revenues have fallen by 60% to about €171 million in the third quarter of 2012. These figures represent almost 100% operating profit for operators so the impact is felt directly in the bottom line. Continue reading “What's up with text messaging?”

The iPhone MOQ

[Kaoru] Kato, president of NTT DoCoMo Inc., said that the firm would want to add the iPhone to its lineup of serviced smartphones if it could form a mutually beneficial contract with Apple, Inc.

Apple requires that carriers servicing its devices sell a fixed amount per year. Katō said that his company could handle such quotas if iPhones accounted for approximately 20%-30% of its overall smartphone sales.

via NTT DoCoMo President Interested in Servicing iPhone — BrightWire

When thinking about an iPhone launch, especially with a new operator, the crucial question is what is the minimum order quantity (MOQ). Some of the iPhone production is sold direct (as in the case of orders coming from Apple’s online store) but the majority of units are sold via operator who order in batches.

This issue came to light when Sprint’s order was leaked in late 2011.  I discussed the order size at the time and put it in context. I concluded that Sprint MOQ was on average 7 million/yr., ramping with 4, 6, 9 and 12 million over a four year period.  I concluded that this was not a particularly aggressive gamble.

Data published since then shows that Sprint actually sold 6.3 million during the first year, well ahead of my expected minimum order of 4 million and above even the expectations for the second year of sales. So far then Sprint and Apple gauged minimum demand quite accurately.

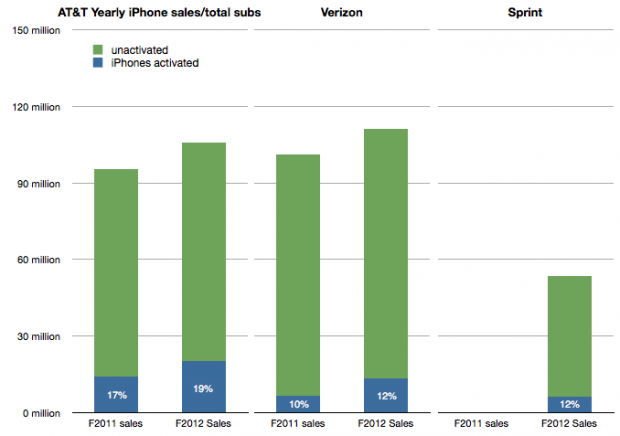
I also showed that the Sprint MOQ was probably indexed off their sub base. I suggested that, based on subs data at the time, Sprint was committing to roughly 13% of its subs buying an iPhone every year. This was indexed off the data showing that 17% of AT&T subs were buying iPhones every year and 10% for Verizon. (I also assumed that this run level would be ramped over time).

The updated totals for the 12 months ended October 2012 are 19% of AT&T subs purchased an iPhone, 12% for Verizon and 12% of Sprint. The performance is shown in the following graph:

Screen Shot 2013-01-17 at 1-17-3.33.10 PM

Which leads us to think about how the MOQ for the iPhone is calculated. If we assume Sprint and Verizon performance is typical it would imply that an operator like DoCoMo would be required to purchase iPhones at the rate of about 10% to 12% of its sub base each year, modulated to some degree by a ramp.

NTT DoCoMo had 60.7 million subs in September 2012. 10% is about 6 million. Is Mr. Kato’s quote above of 20%-30% of smartphone sales consistent with this?

In an earlier interview (in July) Mr. Katō also stated that the target for smartphone sales in the year to March 2013 was 13 million. 30% of that would be 4 million units.

This suggests that the iPhone MOQ for DoCoMo is only about 6% of subs. (4 million) Perhaps this is the basis of negotiation for an iPhone deal. Apple may have held out for 10% subs/yr. with Sprint on the basis of performance of the iPhone in the US but might be willing to settle for 6% subs/yr with DoCoMo, at least for the first year.

The MOQ figure as percent of subs for China Mobile would also be an interesting point of debate.


Cracking the China code: Microsoft vs. Apple

In 2011 Microsoft’s CEO bemoaned that revenue in China was about 5% of what it obtained in the US. Yesterday Apple’s CEO suggested that revenue from China will overtake the US in the near future.

The contrast is even more stark when one considers the time and effort each company has made in China. Microsoft has been investing and promoting itself in China for decades while Apple barely had any presence 3 years ago.

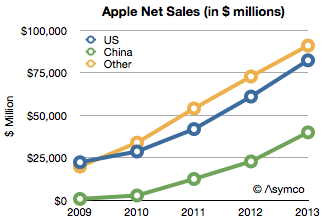
To put a finer point on this I show below Apple’s sales by region:

Screen Shot 2013-01-11 at 1-11-10.08.26 AM

Apple’s China net sales in fiscal 2009 were only 769 million. In 2012 they were $22.8 billion. That is a figure greater than US sales three years earlier. Put another way, China sales grew in three years as much as they did in the US in 33.

The growth rates were astronomical: over 250% in 2010 and 350% in 2011. In 2012 the growth slowed to 83% but that is still almost twice the US or the global average. The growth rates are shown in the following chart: Continue reading “Cracking the China code: Microsoft vs. Apple”

Getting to know the meaning of sisu

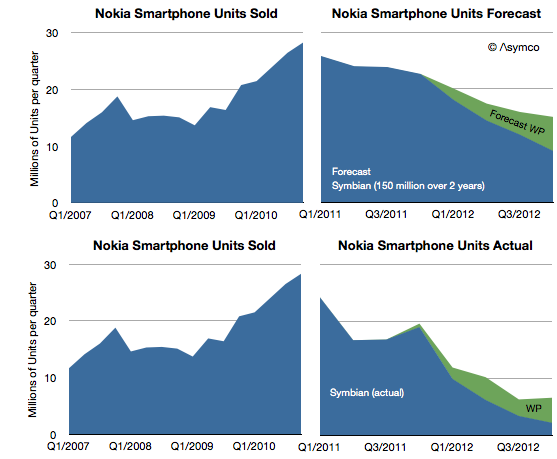
Nokia announced 4.4 million Lumia smartphones were shipped in Q4. That’s about 14 million since the Lumia line was launched a year earlier. It isn’t however nearly enough to replace the lost sales from Symbian. One year earlier Nokia shipped 19 million Symbian phones in the fourth quarter and the year before 28.3 million. The history of smartphone sales from Nokia is shown below:

Screen Shot 2013-01-10 at 1-10-6.23.00 PM

I repeated the forecast I drew up in February 2011 when the platform switch was announced. That forecast was based on the company stating that 150 million Symbian phones would still be shipped. Symbian fell far more rapidly than I (and Nokia) expected and to date only 98 million have shipped. The last quarter’s 2.2 million seems to be so low that it will be hard to imagine the platform lasting more than a few quarters. Continue reading “Getting to know the meaning of sisu”

In search of Apple's microprocessor

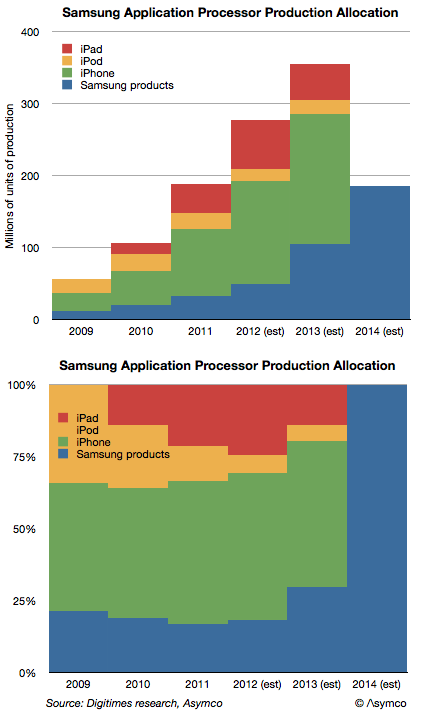
Digitimes Research published an estimate of the allocation of production of application processors by Samsung. It suggests that Apple will transition away from Samsung as a processor supplier during 2013 and stop sourcing altogether by 2014.

Most current capacity (nearly 70%) is said to be allocated to Apple’s products. The iPhone, iPad and iPod touch consumed an estimated 226 million processors in 2012. That demand is expected to increase but it will increasingly to be met by other suppliers in 2013. However, Samsung’s own products will take up some of the slack.

The following graph shows the estimated production schedule by customer.

Screen Shot 2012-12-28 at 12-28-9.57.37 AM

There are several questions that this data raises:

  • Does Samsung’s microprocessor production exceed that of Intel?
  • Who will produce Apple’s processors after 2013. Will it be one or more suppliers is also an open question.
  • Is Apple’s CapEx (est. $10 billion/yr.) being spent on some of this future capacity? A modern fab costs about that much.
  • As the iOS processors are Apple’s own designs, will Apple be integrating production and design?

Prior to his departure Intel’s Paul Otellini had begun speaking about manufacturing. He argued that the “fabless” model was no longer competitive and that design and manufacturing should be re-integrated.

I think we’re about to find out to what degree that will happen.


How much do maps cost and what are they worth?

How much does it cost to have the world’s best maps?

The answer may seem simple: $8.1 billion.

That was the cost to Nokia in cash for buying Navteq in October 2007. It would seem that buying that asset (or another one like it) is a cut-and-dried solution to anyone needing a mapping “solution”. But it’s not an answer that is either complete or explanatory of how mapping solutions are valued.

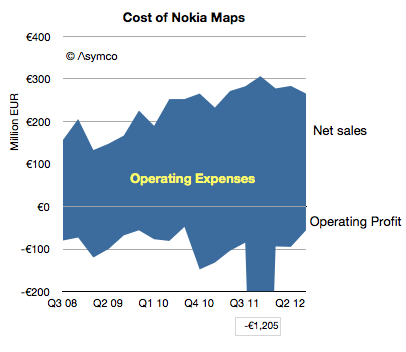
Navteq was not priced as a database for an app. It was a business which was expected to create licensing revenues and profits[1]. The actual price for this business net of cash was $7.7 billion but the following graph shows the net sales and operating profits since Nokia began reporting its performance:

Screen Shot 2012-12-18 at 12-18-3.13.12 PM

The blue area represents the difference between sales and costs and hence the operating expenses–the payments needed to “keep the lights on”. Continue reading “How much do maps cost and what are they worth?”

The new age of Capital Intensity

In the post reviewing Samsung’s Capital Structure I noted that its component divisions have historically taken 90% of capital investments and that the overall capital intensity for Samsung Electronics has increased in proportion to its component revenues.

In another post regarding the capital structures of other technology companies with different business models I noted that Apple has changed its capital structure to a significant degree over the previous three years.

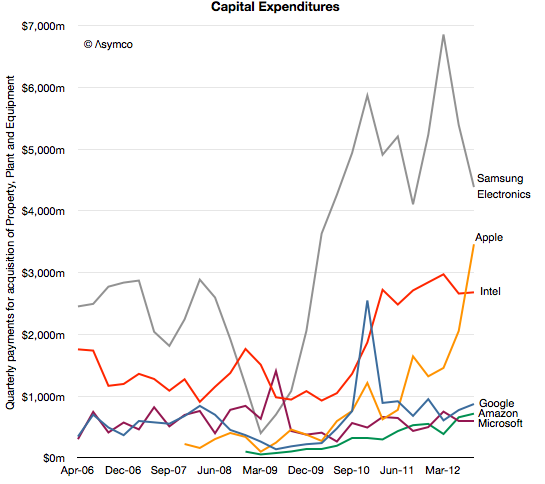
In the following graph I combined these observations to show how capital expenditure patterns may be used to discern the underlying business model.

I would group “cloud” or “platform” based companies like Google, Amazon and Microsoft as a cohort which, although spending significant amounts on capital equipment, do so mainly to support services. Their primary employment of capital is to sustain the infrastructure of data centers necessary to deliver the services underpinning their business models.

Continue reading “The new age of Capital Intensity”

Samsung's Capital Structure

Having described the Revenue, Operating Margin and cost structure for Samsung Electronics it’s time to review their investment strategy.

The Economist summarized it well:

[Samsung’s] businesses look remarkably disparate, but they share a need for big capital investments and the capacity to scale manufacture up very quickly, talents the company has exploited methodically in the past.

Samsung’s successes come from spotting areas that are small but growing fast. Ideally the area should also be capital-intensive, making it harder for rivals to keep up. Samsung tiptoes into the technology to get familiar with it, then waits for its moment. It was when liquid-crystal displays grew to 40 inches in 2001 that Samsung took the dive and turned them into televisions. In flash memory, Samsung piled in when new technology made it possible to put a whole gigabyte on a chip.

When it pounces, the company floods the sector with cash. Moving into very high volume production as fast as possible not only gives it a price advantage over established firms, but also makes it a key customer for equipment makers. Those relationships help it stay on the leading edge from then on.

The strategy is shrewd. By buying technology rather than building it, Samsung assumes execution risk not innovation risk. It wins as a “fast follower”, slipstreaming in the wake of pioneers at a much larger scale of production. The heavy investment has in the past played to its ability to tap cheap financing from a banking sector that is friendly to big companies, thanks to implicit government guarantees much complained about by rivals elsewhere.

Can we find evidence of this capital intensity?

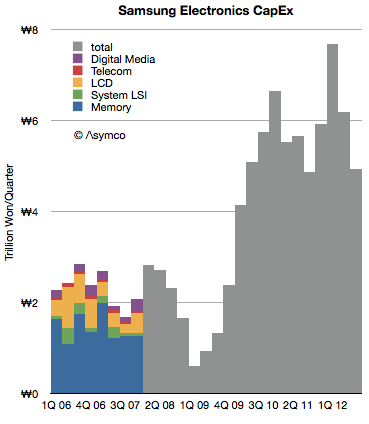
To answer, I reviewed Samsung Electronics CapEx as reported in their quarterly cash flow statements. The following graph illustrates the data:

Note that during 2006 and 2007 the company specified expenditures on an operating divisional level. Since 2008 it has reported only a total. For the years where divisional detail is available, the percent split looks as follows. Continue reading “Samsung's Capital Structure”

Apple's new factories

Two years ago, almost to the day, I wrote a post titled It’s time for Apple to look at owning factories again.

What I argued then was that of the problems that Apple had the means to fix, production was what most needed fixing.

Since then we’ve seen evidence of significant investment in manufacturing tooling, where Apple is effectively purchasing the means of production rather than just renting or contracting it out. This capital equipment investment is the equivalent of owning one of the three asset classes that make up a manufacturing operation:

  1. Tooling or capital equipment. The “Capital” at the root of the concept of “Capitalism”.
  2. Skills, talent and knowledge. This is the softer kind of asset that turns out to be harder to replace or buy.
  3. Labor pool. Although considered a commodity even unskilled labor is difficult to obtain if flexible employment is needed in a regulated environment.

It did not stop there. It has also used capital to ensure capacity through pre-orders thereby allowing the skills and labor to be more predictably applied by its suppliers (and preventing competitors from having sufficient supplies). Apple has also taken control of chip design for the vast majority of its CPUs thus building a more bespoke supplier chain.

However these are not enough steps to make production “good enough” to meet the demands of a billion customers buying a new product every other year. Continue reading “Apple's new factories”