Samsung’s recent success in mobile phones has been spectacular. It overtook Nokia for the top spot in overall unit sales. 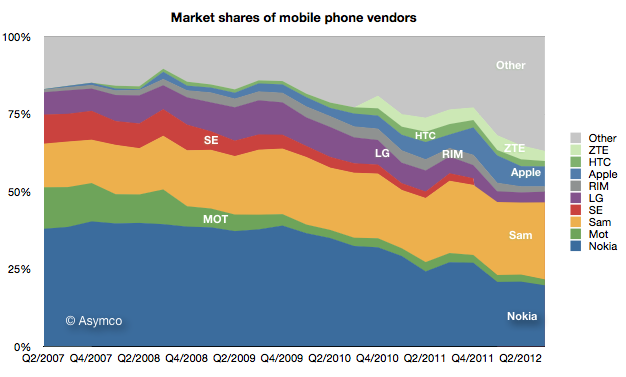 It went from having almost no smartphone sales to selling over 50 million units per quarter in a matter of two years. Continue reading “Google vs. Samsung”
Category: Industry
Mobile Computing Industry
ReCapEx now available for iPad, iPhone and iPod touch
In addition to the video (On Capital Spending’s Transformation of the Electronics Industry – YouTube), you can download the presentation used as an iPad Perspective story here.
It is a featured story on Perspective App on the iPad and now on iPhone and iPod touch.
The late smartphone adopter paradox
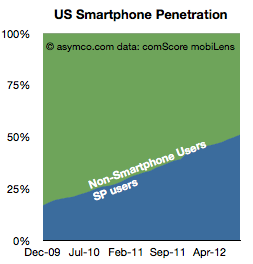
comScore reports that US smartphone penetration has decisively crossed over 50% in August. This should not come as a surprise as the penetration rate has been very linear.
Now that we’ve crossed this milestone, the thing to watch is the conversion rate from smartphone non-consumption to smartphone consumption.
The reason is that we don’t know what “saturation” means in smartphones. We can assume it’s at least 80% as about 80% of new phones being purchased are smartphones. What we don’t know is how much above 80% it can be. It could be 100% if feature phones simply stop being made but we can’t be sure if there will be latent demand and how long this will last (similar to the market for black-and-white TVs after Color became commonplace).
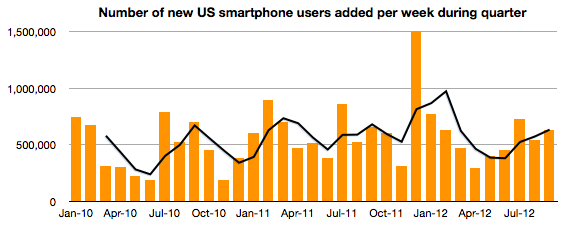
To help keep an eye on this measure, the following graph shows the rate at which non-smart to smart conversion is happening.
It measures the addition of new (to smart) subs each week in a particular measurement period (three months ending the month shown on the x-axis). There is also a 3 period moving average shown as a line. Keep in mind that this shows net new users and therefore excludes smartphone switchers. It’s a good measure of how rapidly non-consumers are being converted to consumers.
The data shows that there are as many first time smartphone adoptions in late 2012 as there were in late 2010. Or, the new-to-smart users are joining ecosystems just as quickly when penetration is 50% as when it was 20%. An encouraging situation when considering the opportunity space above 50%. The “S-curve” has not reached an inflection point.
If you’re thinking about growth, so far so good. There is however one surprise in the data. Continue reading “The late smartphone adopter paradox”
Hey Big Spender
In previous posts I described the patterns of asset value growth for Property Plant and Equipment at Apple and how that change has been thus far correlated to the production of iOS devices.
The analysis was based on looking at the declared value of the PP&E assets on Apple’s balance sheet. These values include depreciation so they reflect not only the “spending” on new assets but also the value lost due to wear and tear. As such it’s not a perfect measure of investment.
The better approach is to use declarations on the cash flow statement. Apple reports a specific cash flow related to PP&E: Under Investing Activities, Payments for acquisition of property, plan and equipment.
In the latest 8-K the amount for the 12 months ended September 29 the value was $8.295 billion.
Compare this with the statement in the Annual Report from one year ago:
The Company anticipates utilizing approximately $8.0 billion for capital expenditures during 2012, including approximately $900 million for retail store facilities and approximately $7.1 billion for product tooling and manufacturing process equipment, and corporate facilities and infrastructure, including information systems hardware, software and enhancements.
Compare also with the PP&E net asset value on the Balance Sheet currently at $15.452 billion but valued at $7.777 billion a year ago (an increase of $7.7 billion).
This means that Apple intended to spend $8 billion, actually spent $8.3 billion and realized a net asset gain (after depreciation) of $7.7 billion.
So there are no major surprises. The spending was only about 4% above expectations a year earlier.
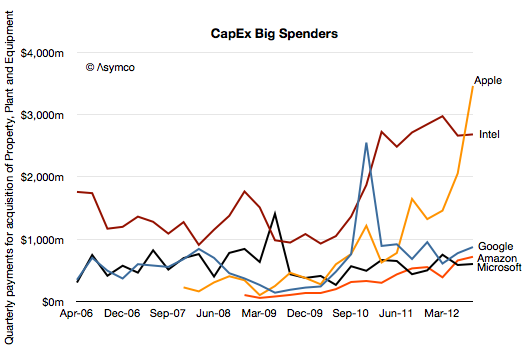
The other pattern to observe is that the spending rose dramatically into the fourth quarter. The fiscal quarterly spending was:
- $1.32 billion
- $1.46 billion
- $2.06 billion
- $3.46 billion
I illustrate this pattern (and previous quarterly spending) in the following chart.
The question remains what is this $8.3 billion being spent on? Continue reading “Hey Big Spender”
Nokia's price for exclusivity
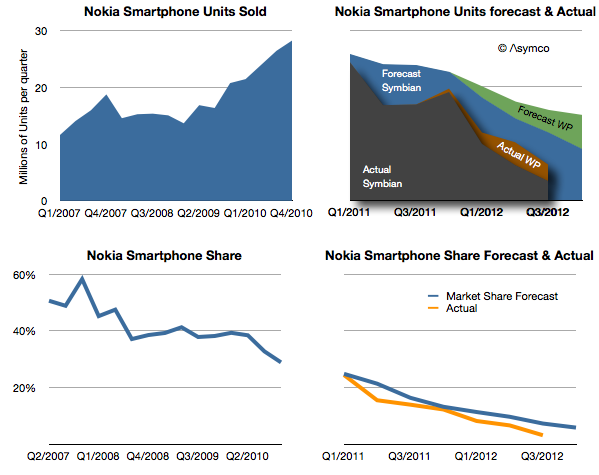
Days after Nokia announced the end of life for the Symbian platform I wrote a post titled Who will buy the next 150 million Symbian smartphones? The reference was to claim by management that before there would be a complete transition to Windows Phone, 150 million legacy Symbian phones would be sold, keeping the company financially stable before the new ecosystem took root.
I reproduce the original forecast I made below with the addition of what actually happened.
Nokia's Lumia brand strategy for the US
Last July I asked the question “How many Lumia phones were shipped in the US?”
My answer was 630k through the first half of this year.
I revisit this question following Nokia’s latest quarterly report.
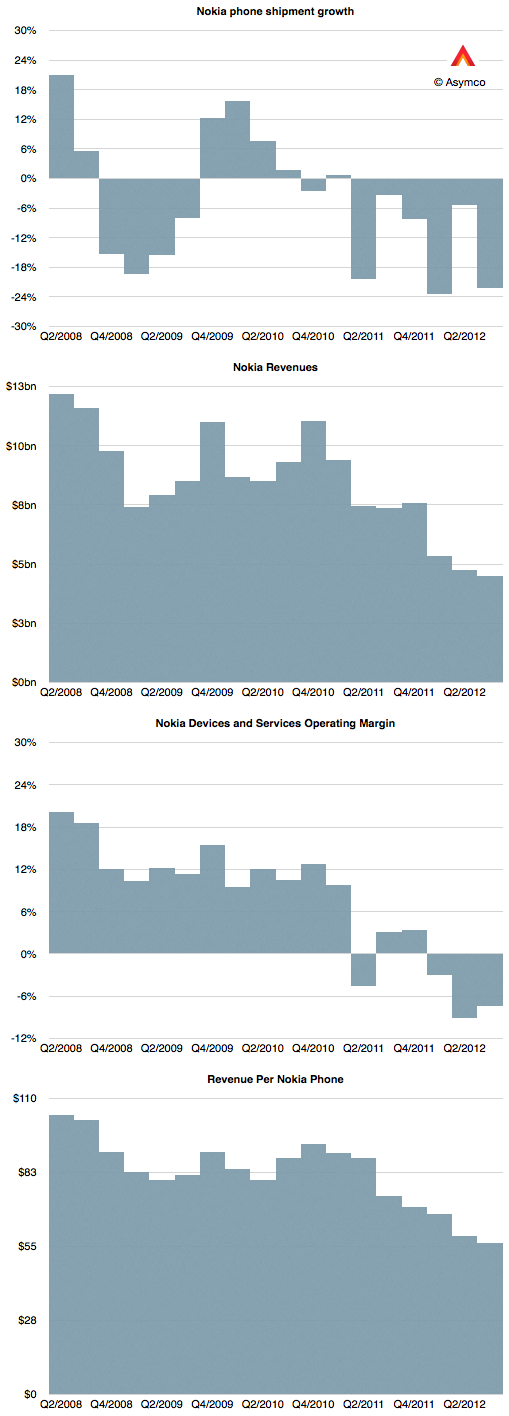
As a quick review, Nokia reported the following performance for its mobile phones operations:
The most worrying thing of all however is that Nokia’s smartphone performance has collapsed. With only 6.3 million units shipped, the company may be the worst performer among eight competitors I track. They were below RIM’s shipment total. Continue reading “Nokia's Lumia brand strategy for the US”
iOS portfolio price distribution
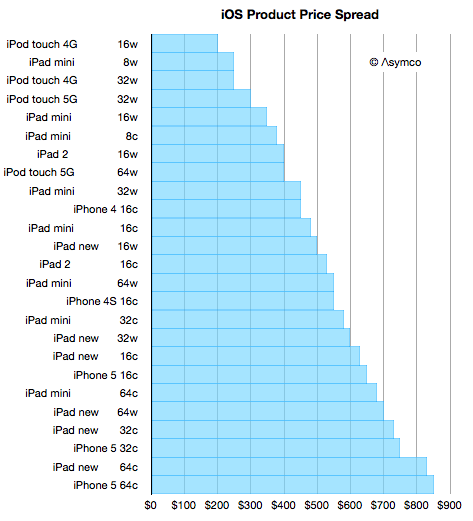
With the iPad mini launch imminent, it’s time to think about the expanding iOS portfolio. We don’t know how much the “mini” will cost or what variants will be available but I took some rumors as a basis to form a hypothesis.
The idea is that there will be 24 variants which have three dimensions:
- 2 colors
- 4 capacities
- 3 radio chipsets
The starting point would be $250 for an 8 Gb WiFi only model and increases of $100 for each doubling of capacity and $130 for the addition of cellular chipsets.
The results would slot into an increasingly broad price spectrum. I included all the models of iPod touch, iPhone and iPad that we already have available and built the following graph.
The Crucible of the Phone Market
[The following was originally published on LinkedIn.]
The US is in the forefront of smartphone usage. This has not always been the case. Five years ago only 3 percent of US phone users were using a smartphone, lower than the global average. At the time Palm and BlackBerry were the prominent devices in the US while in Europe Nokia’s push with Symbian and Microsoft’s licensing of Windows Mobile led to a smartphone adoption rate of about 7%.
All that changed with the iPhone. After 2007 the US began to rapidly catch up and eventually overtook all other regions in terms of smartphone adoption. The latest data from comScore Mobilens shows that the US is now effectively 50% penetrated. The following chart shows just how quickly this happened.

In December 2009 only 17% of Americans used a smartphone as their primary phone. As of August the total reached 49.8%. By today the US is effectively a majority smartphone usage country and it looks like there is no slowing. We might very well see the US reach saturation with 80% smartphone usage in another two years.
Reverting to the mean
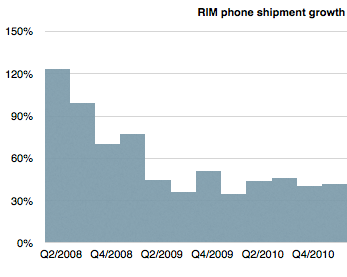
Quarterly financial data is often a lagging indicator of strategic success. RIM’s vital signs were exceptionally strong up until early 2011. Consider the following graph showing RIM’s device growth.
Using language commonly heard among analysts, one would say that the company was “reverting to the mean” and growing nearly in-line with the market. In other words, exceptional growth was over but continuing growth was likely. The company was returning to something “normal.”
However, keen observers of the market would have been hard pressed to find any reason for justifying that performance. Seen through a disruptive lens, it was evident as early as 2008 that RIM’s strategy was not sustainable. The company had a very weak smartphone product relative to emergent iOS and Android ecosystems. And yet, the company continued to prosper for nearly three years, through 2008, 2009 and 2010. Those shorting the stock during this period would have been unrewarded.
But then in early 2011 it fell off a cliff. Continue reading “Reverting to the mean”
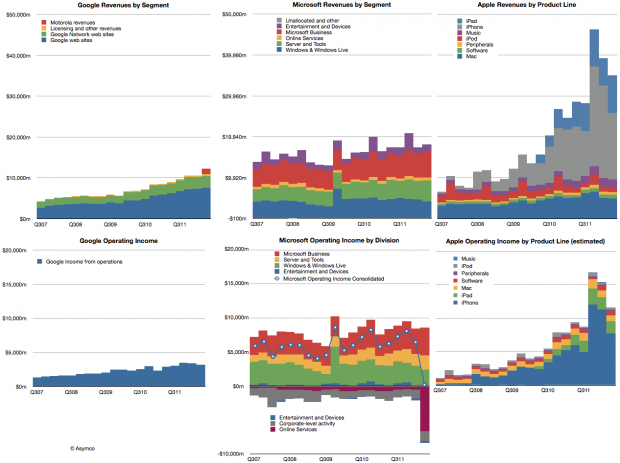
The Interlopers
Google, Microsoft and Apple all had reasonably good second quarters. Microsoft’s revenues grew by 4%, Google’s by about 22% and Apple by 23%. Apple’s growth was disappointing but the other companies weren’t. The revenues for the three companies are shown in the following charts:

