Are Apple stores overstaffed?

ifoAppleStore’s Gary Allen alleges that John Browett, head of Apple Retail, felt the stores were “too bloated”. He cites “numerous tipsters” that Browett ordered a reduction in the number of employees. As the information on employees and visitors is public, we can quickly test the assumption.

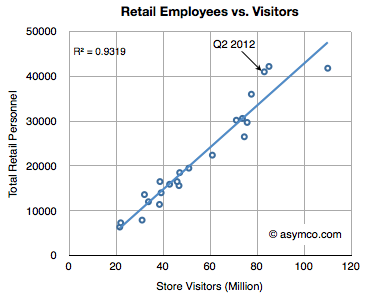
The following graph shows the relationship between Retail employees and Visitors on a global basis.

The total figure for the last quarter was 41,000 employees for 83 million visitors. This is above the expected ratio as shown by the line shown in the graph. Reversion to that line would imply that about 35,000 employees should have sufficed during that quarter.

However, Apple’s business is cyclical and employment is not–or at least not on the same frequency of cycle. Continue reading “Are Apple stores overstaffed?”

American exceptionalism

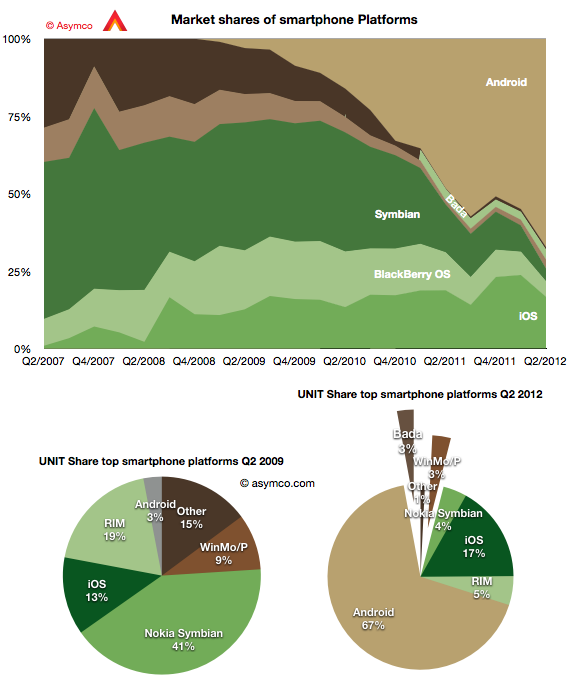
The second quarter showed continuing growth for Android with 19 points of share growth from a year ago. Only Windows Phone showed a gain y/y in share up 1.6 points to about 3%. In the same time, Bada lost half a point, iOS lost 2.1 points, RIM lost 7.2, Symbian 11.4.

The result is shown in the graph below:

I also show a “before-and-after” pair of pie charts which show the difference in smartphone platform market share from the same quarter three years ago. Android went from 3% share to 67% while Symbian went from 41% to 4% and RIM went from 19% to 5%. iOS increased its share from 13% to 17%. Continue reading “American exceptionalism”

Samsung's basis of competition

Samsung has been selling smartphones for a relatively short time. Although the company sold Windows Mobile, Linux and PalmOS during the last decade, it did not gain significant volumes until it began selling Android phones in 2010 with strong operator support.

That support was substantial in the US. The company crashed the Android party in mid 2010 with its Galaxy brand. Trial evidence reveals that the sales level for Galaxy S1 series phones burst out of the gate taking Samsung from 90k units to 2.5 million units in one quarter.

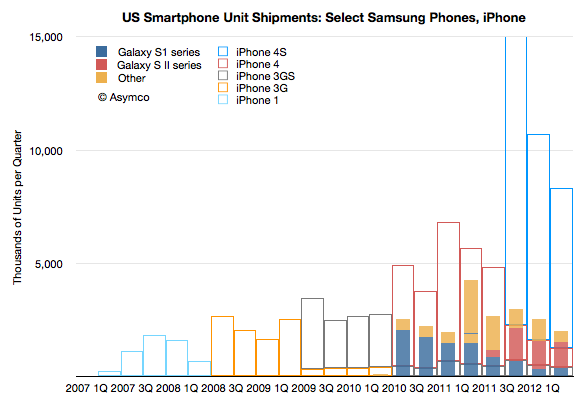
The following graph shows the unit shipments recorded by Samsung for a set of US smartphones.

Note that the profile of sales volume shows a cyclicality with respect to product launches. Each new generation overlaps with previous generations and “fills in” while the older generation product tails off in sales. This is standard portfolio strategy. It also shows the cycle time of launches is approximately four quarters. As the S1 was four quarters old, the SII launched and the SIII follows after four quarters of SII.

What is surprising is Continue reading “Samsung's basis of competition”

Apple Store Operational Economics

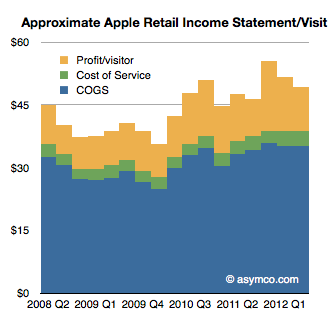
In a footnote to my last post on Apple Retail (The face and the brand) I used data on operating performance from Apple and an assumption about employee salaries (which turned out to be low) to estimate that about 7% of Apple store sales are spent on “cost of service” or the operational expenses, which consist of mostly employee salaries.

An updated view of this store income statement (on a per-visitor basis) is shown below:

To summarize the logic, Continue reading “Apple Store Operational Economics”

Measuring iOS as a gaming platform

At this year’s WWDC Apple offered an update on Game Center accounts. The data we have so far is shown in the following graph.

Before being acquired, another network, OpenFeint, announced 180 million iOS accounts in October 2011. Another figure to consider is the 40 million subscribers to Xbox Live (out of 66 million Xbox users). This subscriber base is paying for a service (about $1 billion per year) so it’s not the same as the free Game Center model.

Rather than being a revenue source, Game Center is designed to engage users and to capture usage information. It also lets us gauge gaming “consumption” on iOS devices. That itself allows us to contemplate it as a gaming platform vis-à-vis alternate platforms.

To consider the figure as a proxy of penetration and engagement, the graphic below shows cumulative sales of gaming devices.[1] Continue reading “Measuring iOS as a gaming platform”

The biggest loser

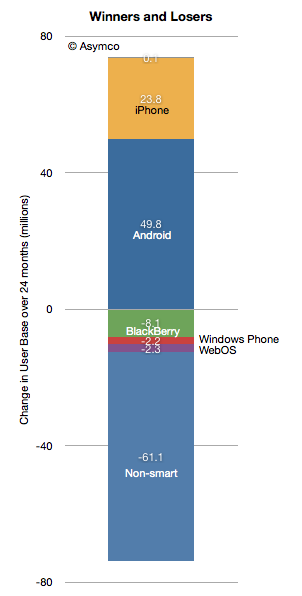
According to data from comScore, in the past 24 months 50 million Americans became Android phone users. In the same time frame Apple added 24 million iPhone users. As I mentioned in my Asymmetric Competition post, it would be unwise to consider this data in isolation. Consider the following graph showing the net change in users in the US.

Android and iPhone grew mostly at the expense of non-smart users. The BlackBerry lost 8.1 million users and all the others only lost about 4.5 million.

With penetration at 50% it’s still impressive that there is so little “churn” between platforms. In fact, measuring churn as the net platform user loss as a percent of all smartphone users, we get something less than 1% per month.

The smartphone competition is still primarily with non-consumption.

That will change at some point when smartphone penetration (shown below) will begin to saturate. Continue reading “The biggest loser”

Perspective and Context in Personal Computing

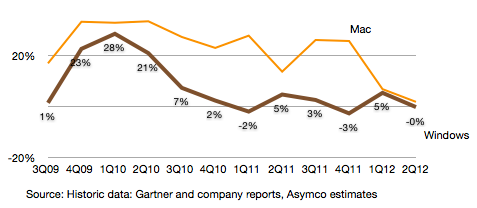
The Mac grew at the extremely low rate of 1.8% over last year’s second quarter. Although it grew faster than the Windows PC market, the gap has narrowed quite a bit. The following graph shows the growth of the two members of the computing Ancien Régime.

We have to wait a few more quarters before we can decide whether the Mac will enter a new phase of diminished expectations. Although it’s not immune from the impact of the iPad, the effect can take a long time to be evident and in either case, growth can come from conversion of Windows users which vastly outnumber loyal Mac users who might upgrade.

If we see the computing market as the superset of keyboard+mouse input and touch-based input then new computing consumption becomes easier to spot: Continue reading “Perspective and Context in Personal Computing”

Cracking the India Code

In my last podcast (Impatient for Growth) I mentioned my frustration at Apple’s slow entry into emerging markets outside of China. I cited Tim Cook’s comments that he did not see an opportunity there in the short term. He mentioned the multi-level distribution challenge which I took to mean the difficulty in setting up Apple stores (in itself due to restrictions on foreign owned retail chains) and the absence of device/service bundling.

This requires more analysis and the best place to start is to look at the data available.

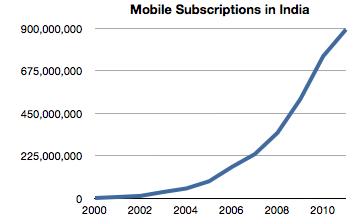
The market potential is enormous. Globally, there are 6 billion mobile cellular subscriptions (end of 2011, ITU) and 86% penetration, but only 1 billion have mobile broadband subscriptions (which make ownership of a smartphone worthwhile).  In India there are 893 million subs (vs 986 million in China).

In 2011 142 million mobile cellular subscriptions were added in India, more than in the Arab States, CIS and Europe put together.

So the potential and growth are spectacular. But that is just 2G. Mobile broadband (i.e. 3G) is rare. Globally, developing countries have only 8% mobile broadband penetration vs. 51% in the developed world. Mobile broadband is a proxy for mass adoption of the iPhone (though perhaps not for Android inasmuch as it’s employed as a feature phone).

The situation for 3G in India is even worse than the overall developing world. Continue reading “Cracking the India Code”

The Future of Apple: A panel session at Fortune Brainstorm Tech

My thanks to Adam Lashinsky of Fortune for inviting me to Fortune Brainstorm Tech in Aspen this week. I was asked to participate in a panel session with Gene Munster of Piper Jaffray to discuss “The Future of Apple”. The session was moderated by Adam.

Here is a full video of our conversation: FORA.tv – Future of Apple.

How many Lumia phones were shipped in the US?

The US is a crucial market for both Nokia and Microsoft’s strategies. This importance was highlighted during the launch at CES in January when not one but three CEOs (Microsoft’s Steve Ballmer, Nokia’s  Stephen Elop, and AT&T’s Ralph de la Vega) were on stage to launch the Lumia. Knowing how well this strategy is working would be very useful to understanding how this market behaves.

My first take on this was when I asked the question How many Lumia phones were sold in the US? The answer suggested through the combination of survey data from Nielsen and comScore[1] was 330,000. The figure is quite small compared to expectations. As it’s so extraordinary, it should be supported by good evidence. Unfortunately the methodology used is weak. The figure itself is probably close to the margin of error of such sampling techniques. It would be nice to have another way to calculate this.

Today Nokia offered another set of data which might help determine how many Lumia phones were shipped in the US. (Note the shipped versus sold distinction. Companies report shipments while surveys nominally measure consumption or usage.)

Unfortunately, Nokia did not offer specific data on US shipments. What they did offer was:

  • Global Lumia shipments were 4 million in the last quarter
  • Global average selling price was €186 for a Lumia phone
  • North American[2] phone shipments were 600k. This includes all phone types and all operating systems.
  • North American sales were €128 million.

That’s all we have. So how can this help with the question of US shipments?

As often happens, it helps to look at the data historically. The following charts show North American shipments and sales with the Lumia launch date highlighted.

While unit shipments were flat, revenues increased significantly. This suggests that we could plot the average selling price of phones in North America (NA) specifically. I did that in the following chart: Continue reading “How many Lumia phones were shipped in the US?”