Apple's Growth Scorecard for the first quarter of 2012

For Apple 2012 started with almost the same growth as 2011 started. Q1 2011 saw earnings growth of 92% and Q1 2012 saw growth of 94%. As the following revenue growth table shows, the pattern for the last twelve months has been very consistent:

Here are some notes: Continue reading “Apple's Growth Scorecard for the first quarter of 2012”

Unforgiven: The consequences of profit failure in mobile phones

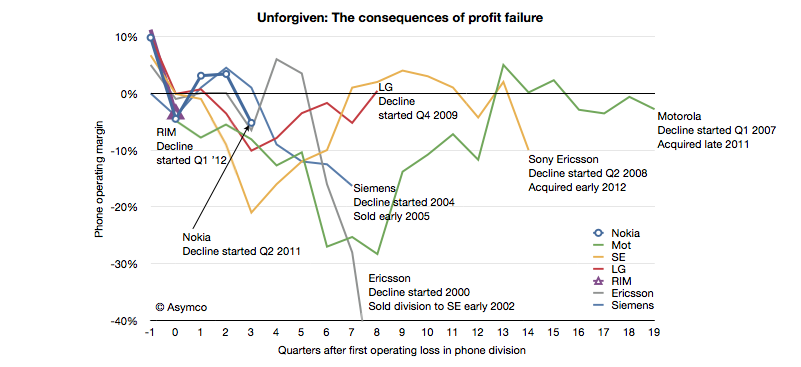
In June of last year I wrote a post titled “Does the phone market forgive failure?” It was written on the eve of Nokia’s Q2 2011 report highlighting the historic consequences of a dip into negative operating margins for a phone vendor.

I listed 13 phone vendors who were either merged, liquidated or acquired. There are no examples of vendors who recovered from a position of loss making.

I was prompted to follow-up by a note Charter Equity Research analyst Edward Snyder wrote illustrating the effect of negative operating margins on phone vendors. I took his illustration and expanded it with additional data.

Since my post in June last year Sony Ericsson and Motorola were acquired making the victims list total 14 companies, with Nokia, LG and RIM having joined the “endangered species list”. If the pattern repeats, then RIM and Nokia are in early phases of what promises to be an extended period of pain followed by an exit.

What the analysis does not answer is Continue reading “Unforgiven: The consequences of profit failure in mobile phones”

Google and Microsoft speak volumes with silence

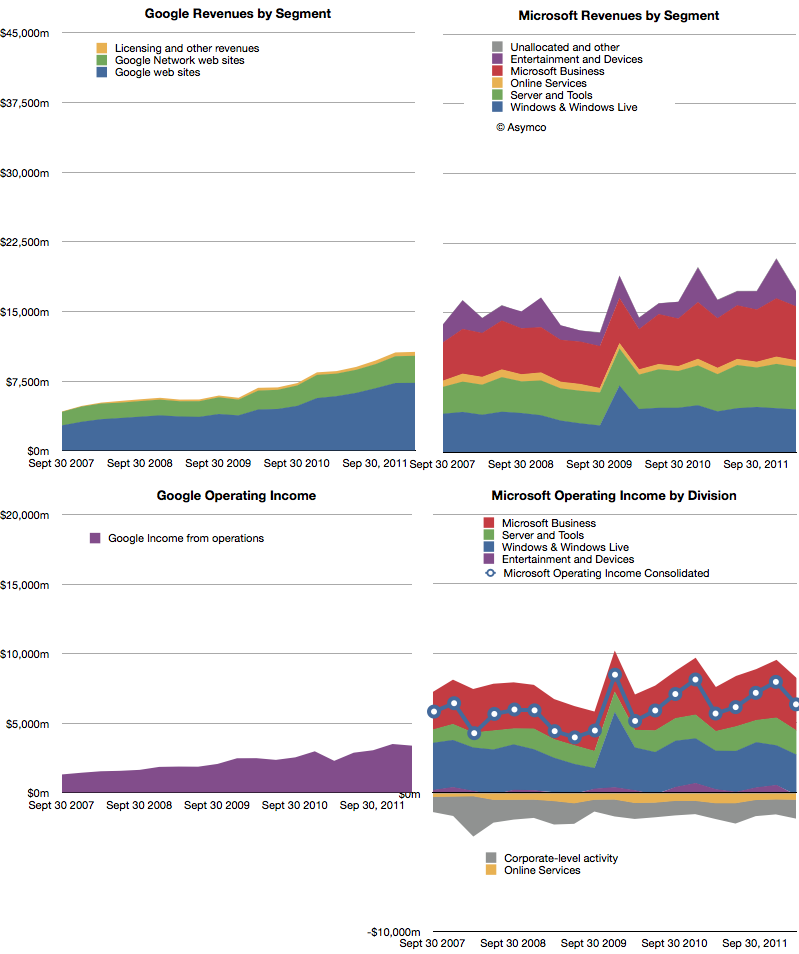
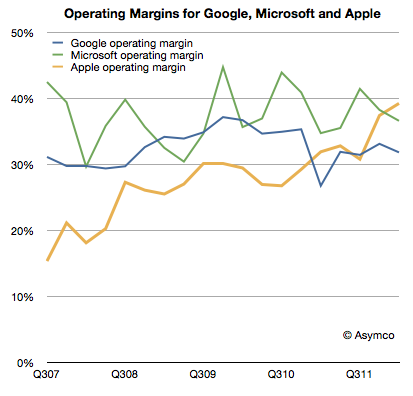
The following charts show Google and Microsoft revenues and operating income:

Both companies showed healthy growth. Revenues: Microsoft 6%, Google 24%. Operating Income: Microsoft 12%, Google 48%. Google had a particularly weak margin Q1 2011 so its income growth appears very strong.

The surprise in Microsoft’s performance was Continue reading “Google and Microsoft speak volumes with silence”

Forecasting Nokia's Windows Phone sales and Microsoft's mobile customer acquisition cost

Our agreement with Microsoft includes platform support payments from Microsoft to us as well as software royalty payments from us to Microsoft. In the first quarter 2012, we received a quarterly platform support payment of USD 250 million (approximately EUR 189 million). We have a competitive software royalty structure, which includes minimum software royalty commitments. Over the life of the agreement, both the platform support payments and the minimum software royalty commitments are expected to measure in the billions of US Dollars. The total amount of the platform support payments is expected to slightly exceed the total amount of the minimum software royalty commitments.

From Nokia’s Q1 2012 financial interim report

The figure of $250 million for Q1 is the same as the amount Nokia received for “platform support” in Q4 2011. This means Microsoft has paid $500 million over two quarters. During the same time frame Nokia shipped approximately three million Windows Phone devices. The average cost to Microsoft to acquire a Nokia Windows Phone user is therefore $167 per user. This is down from $250/user in the last quarter.[1]

If the royalty is equivalent to a license fee then the more interesting question is how and when will the royalty payments nearly match the platform support payments as expected. This might give us an estimate of what both parties are expecting from the relationship. Continue reading “Forecasting Nokia's Windows Phone sales and Microsoft's mobile customer acquisition cost”

Nokia's evaporating brand value

Nokia reported Q1 results following very closely the warning issued last week.

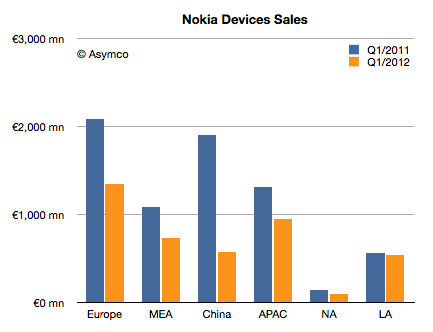
There were few surprises. There is much more detail in terms of regional performance which might be a better indicator of how the smartphone strategy is playing out. I plotted the data in three charts.

Regional Sales Value

A year ago Europe and China were nearly equally valuable as regions to Nokia (€2.1 billion and €1.9 billion, respectively). Even though sales fell across all regions, China fell so much that it has become the fourth in value and nearly the same value as Latin America (€577 million for China vs. €542 million for Latin America). This is a significant reversal for a very important market. The drop in value is a staggering 70%. Is there some clue as to what caused this? Continue reading “Nokia's evaporating brand value”

Apple Stores have seventeen times better performance than the average retailer

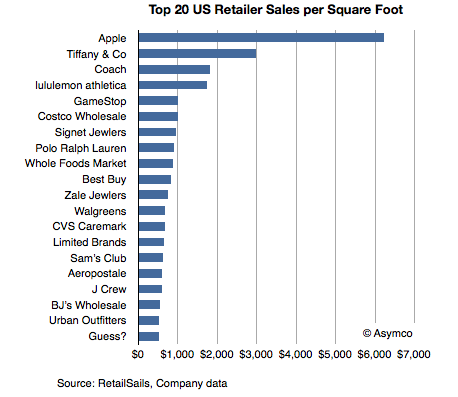
Thanks to RetailSails we have some data on retailers in the US which can be used to calibrate the performance of Apple retail. RetailSails compiled a table of the top 20 chains by sales per square foot (annual basis). The total sample was 160 American retailers (excluding restaurants) that publicly report results.

Sales per unit area is a standard and usually the primary measurement of store success. Here are some benchmark figures:

  • Annual store sales in the range of $300 per square foot is considered respectable in the US.
  • The US national average for regional malls is $341.
  • The average for specialty apparel retailers is $400 per square foot.
  • The average for jewelers is in the range of $600 per square foot.
  • The median for the best 20 US retailers is $787/sq. ft.

The data for the top 20 is shown in the following chart:

The data shows Apple leading by a significant margin. It’s more than twice as efficient as the second place Tiffany and Co. It’s also more than seven times the median of the top 20 and seventeen times better than the average mall retail space.

Note also that this data includes only physical retail and excludes e-commerce, catalog or services revenues. It should only be used to compare physical retail performance.


The achievement is also remarkable when measuring growth in overall sales. Continue reading “Apple Stores have seventeen times better performance than the average retailer”

How Samsung beat Nokia

Nokia currently estimates that Devices & Services net sales in the first quarter 2012 were EUR 4.2 billion, comprised of Mobile Phones net sales of EUR 2.3 billion (71 million units), Smart Devices net sales of EUR 1.7 billion (12 million units),

via Nokia lowers Devices & Services first quarter 2012 outlook and provides second quarter 2012 outlook » Nokia – Press.

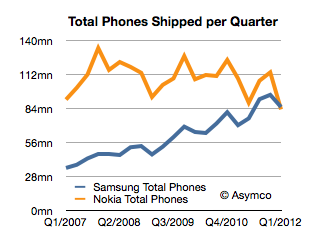
We don’t have the total number of Samsung shipments, however estimates exist. They range between 41 and 44 million smartphones and 44 and 47 million feature phones. The low end of that range would imply Samsung shipped 85 million phones.

Nokia’s press release indicates that it shipped 83 million.

This would be the first quarter that Samsung beat Nokia in total phone shipments. It had already overtaken Nokia in sales volume and profitability last year but this is the most cited metric of market performance: being the biggest in volume. Here is the tale of the shipments:

How did this happen? Continue reading “How Samsung beat Nokia”

When will smartphones reach saturation in the US?

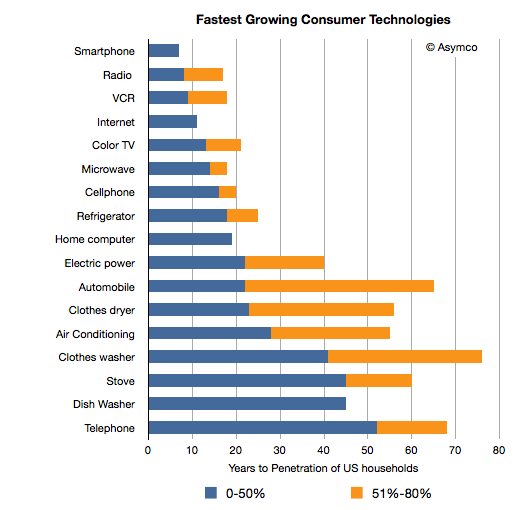
Nielsen has already noted that more than half of US consumers have smartphones. comScore’s data seems to point to that threshold being crossed sometime this year.

If that point is crossed then it would mark the smartphone as one of the most rapidly adopted consumer technologies of all time. I plotted the time it took for a set of technologies to reach 50% penetration of US households.

I also showed the time it took for some of the technologies to reach 80% penetration.  Continue reading “When will smartphones reach saturation in the US?”

Take the money and run

In August 2007, during the HD format wars between HD-DVD and Blu-ray format, Toshiba offered Paramount and Dreamworks $150 million to produce HD versions of their movies exclusively as HD-DVD.[1]

This type of deal is equivalent to an “advance” offered to a book author. The DVD manufacturer pays studios up-front cash for the right to make its DVDs. From an accounting point of view this is treated as an advance that the manufacturer recovers by selling the DVDs back to the studio’s video division in the same way a publisher earns back the advance it gives an author.

In this case, the payment was so large and the sales of HD-DVDs so small that Toshiba was unlikely to earn back the entire advance. The way the deal made any sense for Toshiba was that it was exclusive: the studios could not continue to release their movies in Blu-ray. The deal was done explicitly to hobble a competitor and create “critical mass” of content for its own format.

But then in March 2008, Toshiba threw in the towel and abandoned the HD-DVD format. The way the deal worked, the studios got to keep almost all of the $150 million. They then re-released all their movies in the Blu-ray format. The only “cost” to the $150 million windfall was that there was a nine month delay in the eventual release to Blu-ray–a small price to pay for an emergent format without a large install base.[2]

Platform owners go to great lengths to ensure “content” for their platform. They will, essentially, finance an ecosystem when there are barriers to entry or when competing ecosystems are far more lucrative.

This scenario for movies is being played again with Netflix, Hulu and other distributors who need to fill their pipelines. Netflix’s content acquisition costs are exploding and putting the whole company’s future in doubt.

But this scenario is also being played out with app developers. Most recently, news broke that developers are receiving payments from Microsoft for Windows Phone ports of popular apps. In mobile platforms, apps are the new content and developers are the new studios.  It’s also a practice that is not without precedent[3].

This is as it should be. The value of the platform lies mainly in what is built on top of it just like a foundation is not much use without a house on it. However, the practice of “priming the pump” with cash payments for porting is not ideal. Like spiffs, those who receive payments may become used to it and withhold development if there is no payment. Also, those who did not get payment offers may feel shunned and retaliate in kind. Those who receive payment may become cynical about it and may not put in the extra effort (or, more probably, outsource) to make the work spectacular.

Or, like Paramount, they may just take the money and run if/when the platform fails.

Notes:

  1. Source: The Hollywood Economist 2.0: The Hidden Financial Reality Behind the Movies by Edward Jay Epstein.
  2. Paramount made $250 million more from three “replication output” deals: $50 million from Toshiba for agreeing to release Titanic on DVD in time for Christmas sales, $150 million from Panasonic for agreeing to allow them to take over video replication from Thompson, and $50 million from the law firm Ziffrin, Brittenham and Circuit City stores for agreeing to support the DIVX format. Paramount got to keep the money even though DIVX never launched.
  3. Although it’s never been reported that Apple pays developers for building iOS apps, some developers do benefit from promotional placement and visibility during launch events and from early access to devices or SDKs under development.

Weighing the share of value created

Philip Elmer-Dewitt published a table from Piper Jaffray’s Gene Munster which has some interesting details. Munster has taken a four year “tech sector” view of value creation (and destruction) and tried to see if there is a bound on the value Apple can continue to capture. This “share of value” is one of many approaches to bounding an opportunity. You could consider “share of wallet” by measuring disposable income, or “share of eyeballs” by measuring screen time available or even “share of GDP”.

The attractive part of the share of value of industry is that we have an implicit way to see winners and losers, or the transfer of wealth from one group to another. I charted the data published as follows:

Seen in this context, Apple generated nearly as much value[1] as RIM, Nokia, Sony, Dell, HP and Microsoft destroyed. The rest of Continue reading “Weighing the share of value created”