The parable of RIM

Here are the highlights from RIM’s latest quarter:

  • 14.1 million BlackBerry smartphones shipped, 13 million sold through
  • 150k PlayBook shipped with sell-through slightly higher. 800k PlayBooks shipped so far.
  • BlackBerry subscriber base up to 75 million
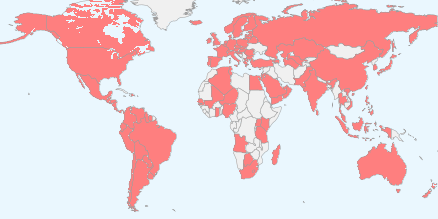
  • High growth cited for U.K., France, South Africa, Mexico and Argentina, Indonesia, Saudi Arabia and South Africa. RIM is the #1 smartphone vendor in the Latin America and Caribbean region. Sales outside the US, UK and Canada were 61% of revenues. US is now 20% of sales, UK 11%.
  • Hardware growth outside the US was 56%
  • There are 630 carriers
  • 50k apps in App World with 5 million downloads per day
  • Forecasting 11 to 12 million smartphones next quarter

Given the channel fill with a new product, the device business was marginal at best. The company obtained -1% growth y/y in units but 31% sequential growth from a transitional quarter. The average selling price (inclusive of service revenues) is $354 and about $280 excluding service revenues. I estimate that operating margins have dropped to about 11%. Not a good story, but one we have been warned to expect.

But a crucial new twist to the story is that RIM announced that they don’t expect new BlackBerry 10 devices until late next year. That came as a surprise and the stock sold off significantly, valuing the company at well below book value.

Stepping back, the biggest surprise is that the company seems to have had no plan for sustaining itself.

Let me explain. Continue reading “The parable of RIM”

Global smartphone penetration nearing 10%

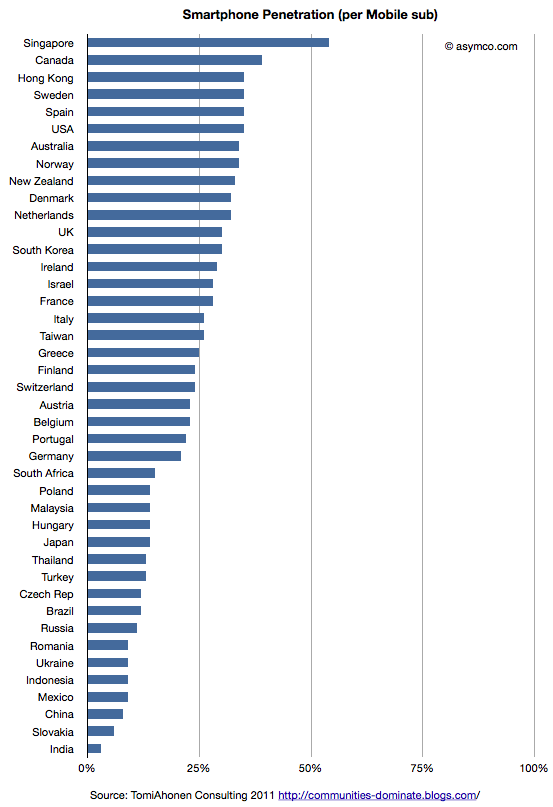
Tomi Ahonen has compiled a fascinating data set on 42 major countries’ smartphone penetration rates. The compilation is based on Netsize Guide, Informa, Google and Ipsos data. It is a complex sample with multiple possible sources of error (read the post for the caveats.) However, this is a breakthrough. It’s the first time I’ve seen this level of detail at a country level in the public domain.

I maintain visualizations of ITU data which shows overall mobile consumption and broadband consumption and penetration. In order to maintain a consistent basis of comparison, I prefer to use ITU’s measure of consumption which is “subscriptions” rather than “population”. The ITU derives this measure because mobile operators think of points of connection (subs) rather than people as the measure of consumption. This makes some sense because connections are what are monetized–not people.

So the first piece of analysis is to show this measure of penetration (smartphones as a percent of subscriptions) for the 42 sampled countries.

This view shows which countries “lead” adoption in terms of penetration. It shows that the US is quite high in the ranking and the most penetrated “large” country.

This is highlighted by the following chart which shows penetration of smartphones vs. total subscriptions with bubble size representing population size. Continue reading “Global smartphone penetration nearing 10%”

Android vs. iPhone

It has no price and hence there are no ways markets can signal demand or value creation. Furthermore, Android is not being offered to users like the iPhone. Android’s “customers” are phone vendors who package the software with additional value-added hardware and sell the combination to operators or distributors who then package it further with services and offer the total to end users.

So obviously, comparisons between Android and iPhone center on instances of Android used in real products and the “market performance” of Android therefore relies on these proxies for Android — the aggregate sum of products that have some form of Android in use.

I wrote this in response to a very short brief: “We’re looking for an editorial piece that comes down on either side of the debate of iPhone vs. Android”. The challenge I saw was on the approach to the question of “iPhone vs. Android”. I chose to measure value creation by the means available to shareholders.

Read more here: Horace Dediu Android Vs. iPhone on BusinessInsider.com

[I am posting this here in the hope that comments will accrue to this forum as well.]

Visualizing Mobile Phone Vendor Performance Through Motion Charts

Warning: This requires Flash.

Try the following settings:

  • Set y-axis to Profit (units: $ Billion)
  • Set x-axis to Volumes (in Millions/quarter).
  • Set Size: Revenues in $Billion. (Scroll within gadget to see Size selector).
  • Set Color: ASP (Average Selling Price in US Dollars)
  • Press Play or use scroll bar to scrub through time.

Note the “Vendor data” tab where you can see the source data and options for different chart types (upper right of chart).

Continue reading “Visualizing Mobile Phone Vendor Performance Through Motion Charts”

The end of the dedicated portable device

On October 27th, Nintendo published half year results for the fiscal year ending in March 2012. Management stated that the company lost over $900 million with a negative outlook. Nintendo cited weaker than expected sales of Nintendo DS hardware and 3DS software and Yen appreciation as the main reasons for the miss. Is this the end of Nintendo?

Before we look more closely, here is a quick summary: The company is exclusively involved in selling game hardware and software. Their console platform is the Nintendo Wii, which will be followed by the Wii U late in 2012. The Nintendo DS and Nintendo 3DS are the company’s portable game consoles. The Wii and the DS are nearing the end of their product cycles. On the software side, the company is known for gaming titles such as Super Mario and Zelda. Nintendo also pioneered the licensing model to allow third-party developers to produce games for its hardware products.

A closer look

Continue reading “The end of the dedicated portable device”

Pac-Man

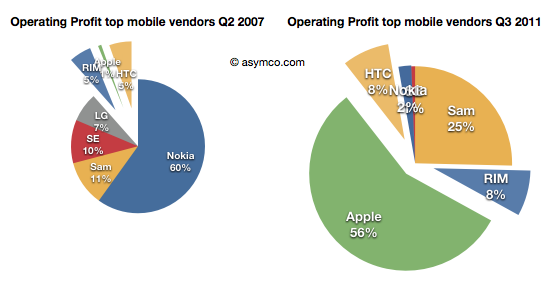
I recently posted a comparison between the profit capture of phone vendors in 2007 and the most recent quarter:

The idea was to show what a disruption looks like. A phenomenon where an entrant with none of the advantages of incumbency takes the profits away from companies privileged with ideal market access and knowledge.

The view of profit shift is the ideal view since it shows the “bottom line” impact and thus the denouement rather than more nuanced sub-plot. However, we don’t always have access to profitability data. Sometimes we only have access to revenue estimates.

Fortunately revenues have a similar story and are often a good proxy. Consider how the evolution of revenue shares occurred in the same market: Continue reading “Pac-Man”

The US smartphone landscape

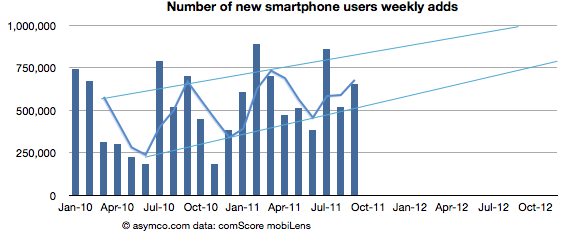
comScore published the latest data regarding US smartphone installed base. To summarize:

  • Penetration reached 37.4%, an increase of 2.9 million or 1.24 points of percentage.
  • Approximately 650k consumers switched from non-smart to smartphones every week during September
  • Based on trailing average of six months’ growth, 50% penetration will be reached by end of September 2012, though the trend is for accelerated adoption (see chart below).

Of the platforms available, Android reached Continue reading “The US smartphone landscape”

The end of the independent phone brand

As shown in the yesterday’s post, in the third quarter, overall mobile phone profitability declined. The eight vendors I use as a proxy showed a total net profit of $8.51 billion, down slightly from $8.57 billion and a drop of $9.01 billion in the first quarter.

Overall, the industry dropped by 1% sequentially but is still up 30% over last year and has a 20% compounded growth rate over a three year period.

  • Nokia returned to profitability, though at $180 million it’s only about 2% of the top eight.
  • Motorola remained in the red with a small loss of $20 million, an improvement over the $90 million loss of the previous quarter. Motorola is being acquired by Google after an accumulated mobile operating loss of $4.69 billion since the beginning of 2007. It’s unlikely we’ll receive any updates on performance thereafter.
  • Samsung had a great quarter with a sequential increase of 19% and year-on-year growth of 130%. The total profit amounted to 25% of the peer group.
  • Sony Ericsson broke even with about $50 million in operating profit. Like Motorola its performance was barely break-even during the last four years and its also disappearing from our list of independent vendors as it becomes part of Sony.
  • LG had its sixth consecutive quarterly loss and is now appealing to investors for more capital to continue operating as a smartphone vendor. Raising dilutive capital seems a radical approach and not one that inspires confidence.
  • RIM had a sequential reduction in profit of 35% and y/y reduction of 30%. The company is exhibiting clear signs of decay and the stock market is valuing the company below book value.
  • Apple profit dropped by 19% but grew 43% y/y during a transitional quarter. The growth remains 43% compounded over three years.
  • HTC has a 1% sequential increase but a 78% y/y growth.

To illustrate the performance in terms of profit, pricing, volumes and margins, I developed the following chart.  Continue reading “The end of the independent phone brand”

Revolutionary User Interfaces

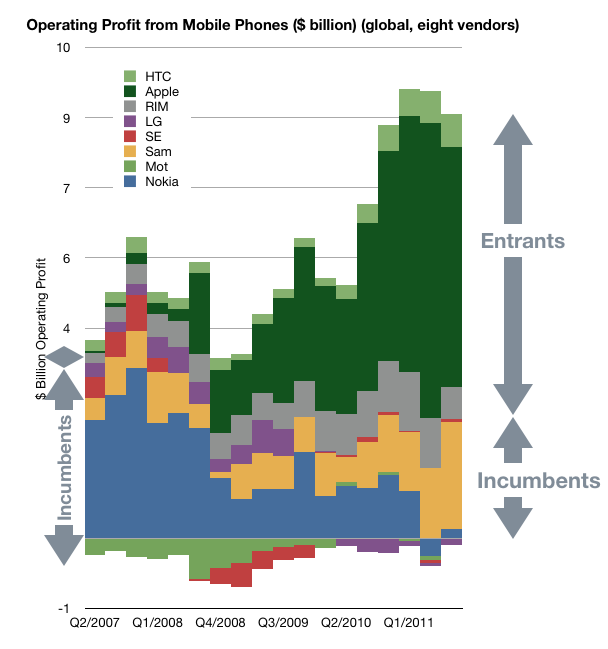
A few years ago, around the middle of the last decade, the mobile phone market was characterized by the rivalry between a few established vendors. These were Nokia, Samsung, LG, Motorola and Sony Ericsson. These incumbent companies had a broad portfolio of devices including smartphones and feature phones and basic phones. Many also sold networking equipment and were deeply engaged with their customers, network operators.

There was also a set of entrants who offered only smartphones.  They were quirky. HTC was a a prominent “ODM” or original design manufacturer who built phones for companies who added their brands and sold and supported the product. HTC made phones and PDAs for operator brands and for some large PC companies. It also began to sell phones under its own brand. RIM was also offering products that had evolved from pagers into email appliances with added voice capabilities. But RIM’s products were not very good as phones. Voice was so poorly integrated that many people carried both a BlackBerry and a voice phone. Then there was Palm with something called a Treo which promised many things but did not quite deliver.

In 2007 something happened which changed the industry. It took a few years to even realize it was happening but by the time it was obvious, it had changed to such a degree that huge companies found themselves in financial distress. This chart illustrates the effect.
In a few short years Continue reading “Revolutionary User Interfaces”

Are Apple’s investments in PP&E extraordinary?

In his recent posts Horace took a look at Apple’s fixed assets and their development over the recent years. He also tested the hypotheses that Apple is making investments into machinery & equipment on which iOS devices are produced by overlaying iOS volumes with preceding changes in property, plant and equipment (PP&E).

The question that has arisen is: Are Apple’s investments in PP&E extraordinary?

To answer, I have compiled the capital expenditures (CapEx) for our previously established peer group [1].

But first we need to clarify what CapEx include and not include. CapEx includes investment into property, plants, equipment, office furniture, larger IT hardware and in some cases patents; CapEx do not include investment into long-term marketable securities or other long-term financial instruments, acquisitions or capitalized R&D. Furthermore, CapEx are gross values and are not net of any sold equipment [2]. CapEx are largely depending on a company’s business model and strategy. For example if you are a manufacturer you need equipment to operate, if you are a software company or a retailer, your business will not be capital intensive.

As the second calendar quarter of 2011 is the latest quarter for which all companies have reported figures, we will take a look at last twelve months’ (LTM) figures from Q2/2011 backwards. The following stacked bar chart shows the combined CapEx of our peer group:


The combined capital expenditures of our peer group for the Continue reading “Are Apple’s investments in PP&E extraordinary?”