The Competition

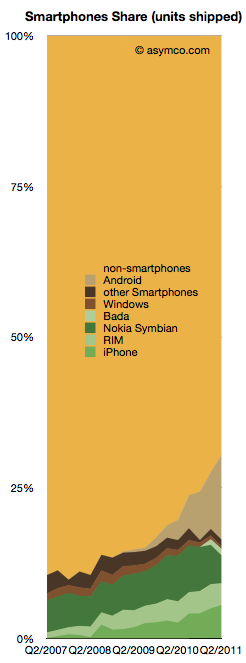
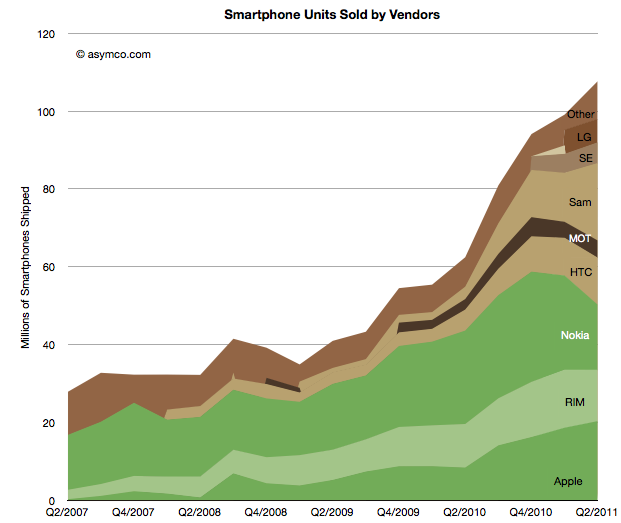
Smartphones made up about 30% of global phone sales last quarter. That is a significant increase from 10% in Q4 of 2007.

From this perspective, iPhone obtained 5.6% share, Android 14.2%, Nokia Symbian 4.6%, RIM 3.6%, Bada 1.1% and Windows 0.4%.

The competition however still has 70.5%.

The chart to the right shows the challenge remaining and the progress being made.

The good news is that the non-smartphone market is not growing while the smartphone market is. In fact, the non-smart market has had a three year CAGR of 0% and a y/y growth of 1.0% and a sequential decline of 6%.

The non-smart portion of each branded vendor’s business is pretty dismal:

  • Nokia saw 17.57% decline y/y
  • Samsung’s non-smart business declined by 8.14%
  • Sony Ericsson’s dropped by a dramatic 80%
  • LG’s fell by 38.56%
  • Motorola is the only one that grew y/y, by 17.86.

The reason all these brands fell is because the unbranded vendors took their place. “Other” non-smartphones grew by 43%. They have been sustaining growth at the rate of 57% compounded over three years.

The following chart shows the increasing share taken by the “other” vendors in non-smartphone units: Continue reading “The Competition”

The Android and iOS pincer movement

Nearly all the data on smartphone shipments is now available for the second quarter 2011. Some fragments are still not public, including ZTE and Huawei (and any others) shipments. We also have estimates for the various platforms including an estimate for Windows Phone and Bada (though not for WebOS).

This allows the following chart:

Using the traditional color scheme which separates “integrated” from “modular” vendors, the chart shows overall volume growth and how the volumes are split among vendors.

The market grew at about 73% y/y and 50% compounded over three years and 9% sequentially. The y/y growth rates for individual vendors were: Continue reading “The Android and iOS pincer movement”

The Samsung hedge: Estimating Bada for Q2 and hence Samsung's Android shipments

The number of Bada phones shipped last quarter is not public, however some assumptions can be made that lead to plausible estimates.

First, we know that Samsung shipped about 3.2 million smartphones in Q2 2010 and that total included Bada and Android (and perhaps even some Windows Mobile).

Second, we know that there were about 19.9 million smartphones in Q2 2011.

Third, Canalys published an estimate that Bada grew by 355% y/y.

So if we knew how many Bada phones shipped in Q2 2010 we could derive the current Bada shipments and also realize how many of the nearly 20 million smartphones from Samsung were actually Android.

The clue is in an estimate from December last year Continue reading “The Samsung hedge: Estimating Bada for Q2 and hence Samsung's Android shipments”

Apple share of phone revenues increased to 28%

As previously pointed out, Apple reached two thirds profit share in mobile phone vendors among the eight vendors I track. The following charts shows the historic growth in that share and the share of revenues (including 4 quarter trend line). Revenue share increased to 28% in the last quarter.

The share doubled from Q4 2009. I should also point out that it was the highest of all the competitors. The following chart shows the split over time: Continue reading “Apple share of phone revenues increased to 28%”

The end of easy growth in smartphones

At the end of last year I was saying that the smartphone boom was a tide that lifted all boats. That is no longer the case.


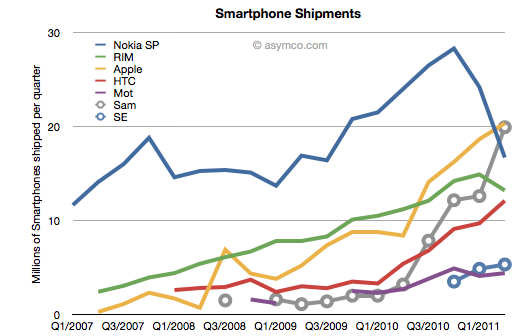
But the big story is that there has been a clear non-seasonal counter-cyclical decline in Nokia and RIM’s smartphone performance. RIM’s steady rise has come to an abrupt halt. Nokia’s decline has accelerate precipitously. So much so that Samsung and Apple have overtaken Nokia and RIM and it looks like HTC will overtake RIM within one quarter and perhaps Nokia as well.

Continue reading “The end of easy growth in smartphones”

The Profit/Phone x Phones Sold Chart

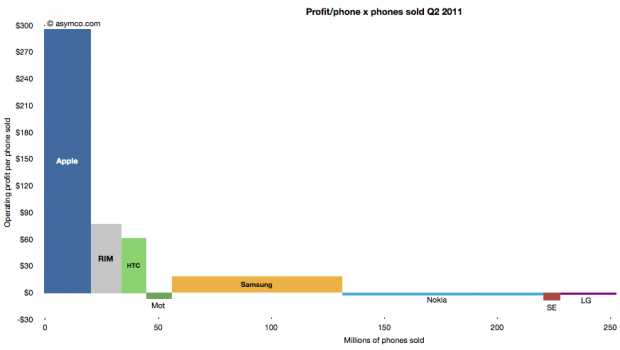
The following chart shows the current profit distribution between phone vendors with an eye toward identifying volume dependencies. The vertical axis represents operating profit per phone and the horizontal axis the number of phones sold.

The area of each vendor bar is therefore the total operating profit that vendor captured. A vertical (portrait) orientation implies high profitability with relative low volume while a horizontal (landscape) orientation implies a high volume/low profitability focus.

The other important observation is that bars can also be negative. Those vendors’ names are listed below the bars rather than within them.

You can also compare the chart with the one from last quarter:

The Rawr Chart | asymco

Apple captured two thirds of available mobile phone profits in Q2

The major publicly traded phone vendors have all reported results for the second quarter. Based on the data available so far we can begin putting together a picture of the market.

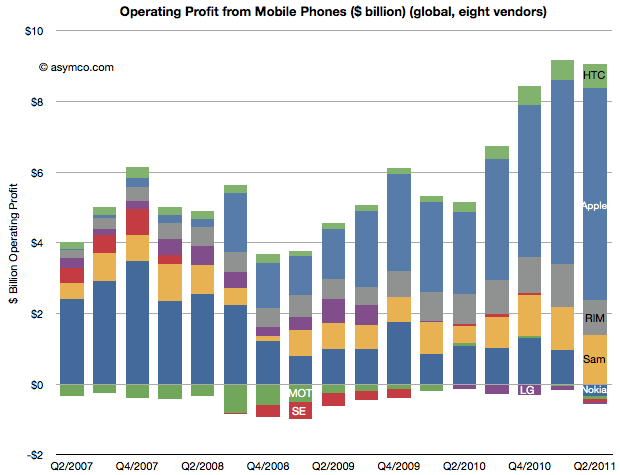
The first picture I’ll draw is usually the last: profitability. The following chart shows operating profit from the sale of mobile phones among the eight vendors I follow (Nokia, Samsung, LG, Sony-Ericsson, Motorola, HTC, Apple, RIM).

This quarter saw a slight sequential decline in overall profit for the sector, but four vendors did not manage a profit from selling phones. Nokia, Motorola, Sony-Ericsson and LG all saw losses. The other vendors split the slightly decreased pie with Apple getting two thirds of it (66.3%)

This share is up from 57% in Q1 and 50% in Q3 and Q4. Samsung’s share went to 15%, though that’s not a peak level historically. In Q1 2008 the company was at 21%. RIM was at 11%, a level in a range that has been unchanged for three years. Finally, HTC captured 7.4%, a new high and an increase from 6% since last quarter.  The profit share chart follows: Continue reading “Apple captured two thirds of available mobile phone profits in Q2”

The iPhone at four; growing up or just growing?

Ever since the iPhone launched four years ago (to the day), the question on everyone’s mind has been: When will Apple expand the portfolio to reach into all market segments? I remember thinking in 2007 whether it would be in six months or a year that they would create a “mini”, “nano” and “classic” line-up which served them so well with the iPod.

Apple however took a different approach. To their credit, they focused on the platform and built a consistent experience around a fixed screen size to nurture an ecosystem. They also improved the power of the device so that experience would improve to be better and more robust. In other words, they treated every iPhone as not being good enough, needful of every megahertz of power, every pixel of screen and every minute of battery life. They polished the OS constantly and added APIs by the thousands.

In other words, they acted like a computer software company, not like a “device vendor” or like a handset manufacturer which was everyone’s (including mine) frame of reference.

Continue reading “The iPhone at four; growing up or just growing?”

Apple could buy the mobile phone industry

The second quarter ends in less than two weeks. When it does, I expect Apple will have over $70 billion in Cash, Cash Equivalents, Short-term marketable securities and long-term Marketable Securities. That figure has been growing predictably.

Also predictable has been the decline in value of Apple’s mobile phone competitors. Most spectacularly Nokia and RIM. The enterprise values of the public companies selling 75% of all phones sold world-wide are as follows:

  • Nokia $22.6b
  • RIM $13.8b
  • HTC $25.4b
  • Motorola Mobility $4.2b

The values of the profitable phone-making subsidiaries are a bit more difficult to estimate but we can use multiples of trailing operating profits. I generously use the multiple applied to HTC (14).

  • Sony Ericsson $0.21b x 14 = $3.0b
  • Samsung $3.76b x 14 = $53b

That leaves valuing LG’s phone business which has not been profitable in the last four quarters. I assume a nominal value of $10b. These data points are shown in the following chart: Continue reading “Apple could buy the mobile phone industry”

iPhone liquidity: Why an unlocked Phone in the US matters

The iPhone is now available in the US unlocked. Judging by the lack of reaction to the news, one would assume that this is not a significant event. I would argue however that it’s a very significant event.

What is unappreciated is that the iPhone is a very restricted product. Unlike any of Apple’s other products (iPod, Mac and iPad), the iPhone is designed to be hard to get. Apple did not make it easy in the one dimension of ease that matters most: its purchase.

Consider that many people in the world cannot buy an iPhone because it’s not available locally. In case it is, in most cases you need to sign a contract and commit to a long-term relationship with a company other than Apple. In those cases where you don’t sign a contract, you cannot use it with a service provider other than the one (arbitrarily) chosen for you.

A few have been able to buy iPhones unlocked if they lived in a few countries (UK, France, Australia, Belgium, Hong Kong[1]) but those phones could only be purchased online if sent to a local address or in an Apple retail store–of which there are not many.

Consider that in Europe alone, the following countries do not have iPhone distribution:  Continue reading “iPhone liquidity: Why an unlocked Phone in the US matters”