Peak Cable

Paying for TV has been a curious consumer phenomenon. There was a time when TV was free to consumers. It was delivered as a broadcast over-the-air and paid for either by commercials (US mostly) or by taxes on viewers (Europe mostly). The consumers were delighted with the idea as it was far better than radio and radio was delightful because it was far better than no radio.

The process of convincing consumers to pay for something that used to be free was quite interesting. The first benefit to be articulated was that the quality of the picture would be much better. It would, in essence, be noise-free.1

The second benefit was an increase in the number of channels. VHF and UHF television would cover about three and 5 channels respectively while cable could offer dozens, many specializing on specific types of content like the Home Box Office (HBO) offering movies and ESPN offering sports only and MTV music videos and CNN news only.

The third benefit was fewer (or no) commercials for some of the channels. This was especially valued by fans of movies whose interruption by commercials was often detracting from the immersive value and continuity of the cinematic experience.

These benefits were very attractive during the 1980s, to the extent that about 60% of US households adopted cable. An additional group later adopted satellite-based pay-TV as the technology became reasonably cheap.

Screen Shot 2015-03-19 at 2.29.06 PM
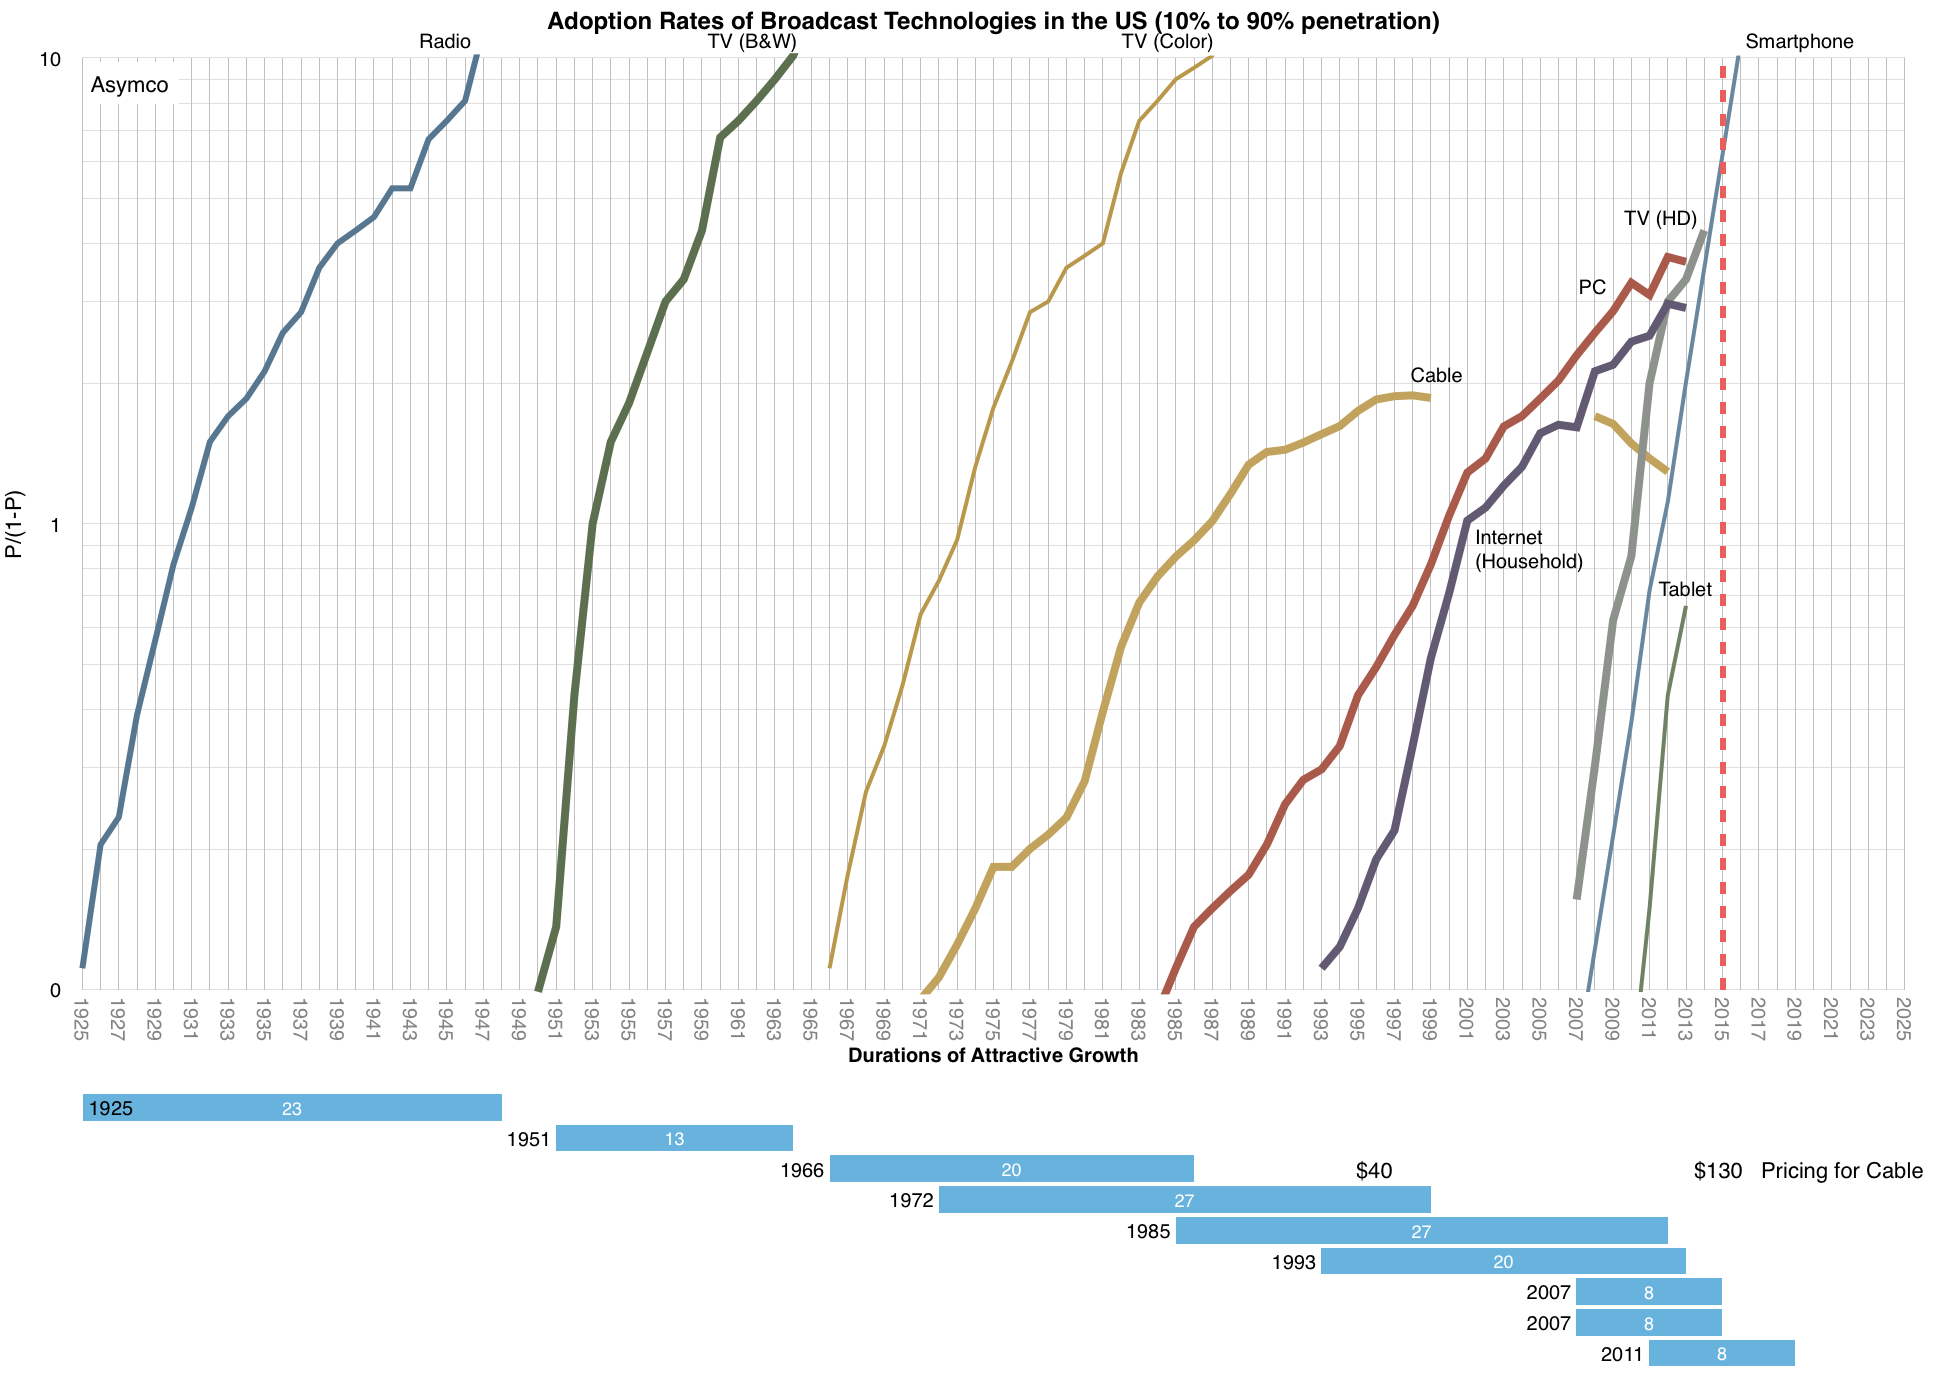
These benefits were priced modestly but as the quality and breadth of programming increased, prices rose. An average cable bill of $40/month in 1995 is $130 today2. Some of that revenue went into upgrading the capital equipment in use (the plant) and some into paying for the higher production values. Yet more went to the sports leagues and their players whose business models increasingly depended on broadcast rights.

Continue reading “Peak Cable”

  1. This was in fact the birth of cable TV: a shared antenna for a community in an  electromagnetic shadow []
  2. a 6.1% compounded rate of price growth vs. a 2.4% rate of inflation []

The Entrant’s Guide to The Automobile Industry

Like a siren, it calls.

The Auto Industry is significant. With gross revenues of over $2 trillion, production of over 66 million vehicles and growing1 it seems to be a big, juicy target. It employs 9 million people directly and 50 million indirectly and politically it must rank among the top three industries worthy of government subsidy (or interference). Indeed, in many countries–the US included–government interference makes it practically impossible for a producer to go out of business, no matter how poorly it’s managed or how untenable the market conditions.

But this might be the tell-tale sign that danger lurks. Theory suggests that incumbents going out of business is an essential indicator of industry health. Without their exit, entrants are never allowed to bring disruptive ideas to bear and innovation simply stops. Is this interference with mortality the only indication of entrant obstacles? Are things about to change? Is there pressure for innovation? Can we spot other indications of a crisis in this industry?

Taking the US as a proxy, here is a graph of the number of new car firm entries (and exits):

Screen Shot 2015-02-23 at 6.58.54 AM

The total number of firms2 that entered the US market is 1,556. The blue line graph shows the entries and the orange line shows the exits. This sounds impressive, but note that the year when the peak of entries took place was 1914, exactly 100 years ago. Continue reading “The Entrant’s Guide to The Automobile Industry”

  1. The industry continues to grow, registering a 30 percent increase over the past decade, mainly due to Asia and China in particular []
  2. counted as brands []

The Critical Path #141: Old Dogs

Horace presents the next class in The Critical MBA. Having too much of a fundamental footing could be a disadvantage when evaluating what theory might apply to a given situation. Could this be why so many fail to understand Apple? In the second half of the show, Horace and Anders discuss Amazon as retail goes online.

via 5by5 | The Critical Path #141: Old Dogs.

Bigger than Hollywood

Apple paid $10 billion to developers in calendar 2014. Additional statistics for the App store are:

  • $500 million spent on iOS apps in first week of January 2015
  • Billings for apps increased 50% in 2014
  • Cumulative developer revenues were $25 billion (making 2014 revenues 40% of all app sales since store opened in 2008)
  • 627,000 jobs created in the US
  • 1.4 million iOS apps catalog is sold in 155 countries

Putting these data points together with others from previous releases results in a fairly clear picture of the iTunes/Software/Services1

Screen Shot 2015-01-22 at 1-22-10.38.39 AM

The App ecosystem billings (what consumers actually pay) is shown in the red area above. 70% of those payments are transferred directly to developers and Apple reports the 30% remaining as part of its revenues. This view of the iTunes ecosystem shows the impact of Apps relative to the other media types. When we measure the payments to the content owners we can see that Apps also dominate:  Continue reading “Bigger than Hollywood”

  1. soon to be renamed Services and encompass everything under the heading of iTunes software and services today including content, apps, licensing and other services and beginning Q4 2014 it will also include Apple Pay. []

The 2015 “Sleeper Ideas” List: Trends, Stocks, And Private Companies To Watch – Forbes

My choices:

1. Cyanogen. This company should develop a credible path for AOSP (non-Google Android) especially in India. I expect a lot of traction as OEMs who embrace Android reject Google.

2. iPad. Not as a consumer product but for the Enterprise. The iPad grows up into a solid product for business while being replaced by phones in consumer “jobs to be done”.

A few more ideas are listed here: The 2015 “Sleeper Ideas” List: Trends, Stocks, And Private Companies To Watch – Forbes.


Biggest news of 2014

As corporate romances go, IBM and Apple’s must rank among the most unexpected. As I wrote on the date they changed their Facebook status, the two companies were antagonists for the better part of twenty years and their rapprochement was met with a shrug mostly because yet more decades passed since.

Screen Shot 2014-12-26 at 11.28.03 AM

Nostalgia aside, this new union is profoundly important. It indicates and evidences change on a vast scale. The companies’ antagonism was due to being once aimed at the same business: computing. Since the early 1980s, “computing” came to be modularized into hundreds, perhaps thousands of business models. It is no longer as simple as selling beige boxes. IBM was forced out of building computers and into services and consulting while Apple moved to make devices and the software and services which make its hardware valuable.

The convergence of interests which was consummated into a deal this year stems from the migration of computing around what has come to be called “mobile”. Apple intends to accelerate the adoption of its mobile platforms among the remaining non-adopters: enterprises–a group which, by now, qualifies as laggards.1 Simultaneously IBM intends to connect data warehouses at those same enterprises to their employed users.

Continue reading “Biggest news of 2014”

  1. There was a time–when Apple was young–when enterprises were the innovators, early adopters. That role ended approximately in the year 2000 []

Retail in 2020

This year’s Thanksgiving and Black Friday data from IBM shows a continuing pattern of growth for mobile devices. As the graph below shows, in the five years since 2010 mobile devices grew from 5% of the online shopping traffic to 50%.  Traditional computing (desktop and laptop) made up the difference.

Screen Shot 2014-12-01 at 10.34.30 AM

The graph also shows that sales value via mobile devices crossed over 25% of online spending. The fact that mobile shopping is not equal to mobile spending is due to the convenience factor of mobile. It’s more likely that users will spend idle time scanning for bargains or tracking down ideas from friends but wait until they are at home to make the final purchase decisions in front of a computer.

The transition to spending directly from a device is a slower process, but that process was also one that online had to undertake as buyers became comfortable with online commerce. When it comes to payment, buyers are understandably more cautious.

This does not change the prediction made last year that “the transition to post-PC consumption will also be practically completed by 2020”. That leaves six years for mobile saturation and a total transition time of one decade.

At that point I expect 90% of browsing and perhaps 75% of spending to be happening on devices. Some of this will undoubtedly be enabled by biometric authentication as shown by Apple Pay. Trust and ease of use in this technology will undoubtedly accelerate the transition making mobile payments more comfortable and secure than on the legacy computer.

What is less predictable is how much those devices will also be used to transact payments for the physical retail stores. In some scenarios it’s possible that by 2020 a majority of all shopping will be enabled by devices.1 That would subjugate the retail segment to the power politics of mobile platforms.

It is interesting therefore to note the mix between the platforms in the graphs above.

  1. There is also the matter of in-store discovery and advertising via NFC and bluetooth i.e. iBeacon []

Yet another billion dollar business

I tried to assess the opportunity of Apple Pay but found it to be mostly dependent on how quickly card payments will overtake cash. It seems that as payments move to a digital format they will move to a mobile device. The hurdle isn’t going from a card to a phone but from cash to card.

Data published in The Growth and Diffusion of Credit Cards in Society  shows that between 1970 and 2001 households with at least one credit card in the US grew from 17% to 70%. More recent data shows 82% of US consumers have at least one credit card and 77% have a debit card.

The Total Addressable Market for Apple Pay then is dependent on how quickly this pattern repeats over the markets where iOS devices are in widespread use. Once cards are in use they are used with higher frequency and quickly overtake cash for the user.

The only assumption that needs to be made is that the device then replaces the plastic card. This seems a safe assumption as the benefits of the device as payment authenticator are high and the costs are negligible given a penetrated market.

The following graph shows an extrapolation of transaction volumes where Visa and MasterCard and Amex are showing moderating growth with UnionPay showing 20% constant growth through 2019.1

Screen Shot 2014-11-28 at 12.58.21 PM

Two more assumptions are needed: the share of transaction value captured by Apple Pay and the Apple Pay fee. I used 15 basis points ($15/$10000) as the assumed Apple fee and a share schedule as follows: Continue reading “Yet another billion dollar business”

  1. Supporting these assumptions is a forecast from Nilsen showing total number of cards in circulation by issuer and a forecast of total transactions Screen Shot 2014-11-28 at 1.40.01 PM []

Faster Followed

Samsung’s smartphone ascent was breathtaking. From having essentially zero market share in the category in late 2010 to becoming the largest vendor took less than two years. In doing so it grew to become the largest phone vendor, smart or not–a goal which eluded them during the previous decade of effort. Samsung went on to capture not only the lion’s share of unit volumes, they also took almost all the profits in the Android mobile phone market.

And in a market filled with competitors. Literally hundreds of vendors and thousands of products were available at every conceivable price point. Samsung did away with HTC, LG, and Motorola. HTC, the first Android vendor (and first to market with Windows Mobile), Motorola, Google’s launch partner in the US and “Droid” brand partner (and future owner).  Google’s own Nexus products. Samsung Galaxy ruled them all.

Galaxy swamped the Chinese market and the Indian market, the largest in the world. They were so powerful that they were singled out both by Microsoft and Apple for IP royalties.

All within two years or the average life-span of one smartphone.

But something went wrong in 2014. Growth in shipments suddenly stopped. This was not a problem with the overall market, which kept growing. The slowdown did not affect other vendors, especially the up-and-coming Lenovo and Xiaomi and the second and third tier vendors whose names are  known only in the local markets they serve.

The result of this slowdown is shown in the following graphs: Continue reading “Faster Followed”

One billion sold

In Q3 2014 Apple’s revenues were 5.3% higher than the upper end of their guidance. This is the highest error in guidance since the new range-bound  reporting regime started two years ago.

The following graph shows the guidances given since 2005 and the actual revenues. The error (as a percent of upper guidance) is given in the second graph.

Screen Shot 2014-10-23 at 10-23-10.44.28 AM

Continue reading “One billion sold”