In the postmodern computing world that we live in, the measure of success isn’t revenue or profit or units sold but the number of users that an ecosystem can attract. Therefore the monthly active user (MAU) unit of performance seems to be in vogue right now. E.g.:
- Facebook claims Messenger has more than 200 million MAUs
- WhatsApp has 500 million MAUs, 48 million of whom are in India
- Line last month announced that it had 400 million users (active or not)
- WeChat claimed 355 million MAUs
- Viber claims 105 million MAUs
Startups are aggregating these millions of MAUs in order to obtain valuations for raising capital and the faster the growth in MAUs the more “successful” the company is considered.
When companies are acquired it’s common to take the transaction value and divide it by MAUs to get an idea of “what an user is worth”. This is because there are no revenues to measure and MAUs are taken as a proxy. However, the process by which a MAU becomes a dollar of profit is, to put it kindly, circuitous.
For most (all?) it’s not yet clear how it happens especially since not all MAUs are created equal and MAU loyalties can change rapidly and if we added all the projected revenues each MAU will contribute to each app on her device we might reach some absurdity. In actuality, today, for the companies listed above, there are no revenues at all directly from their services.
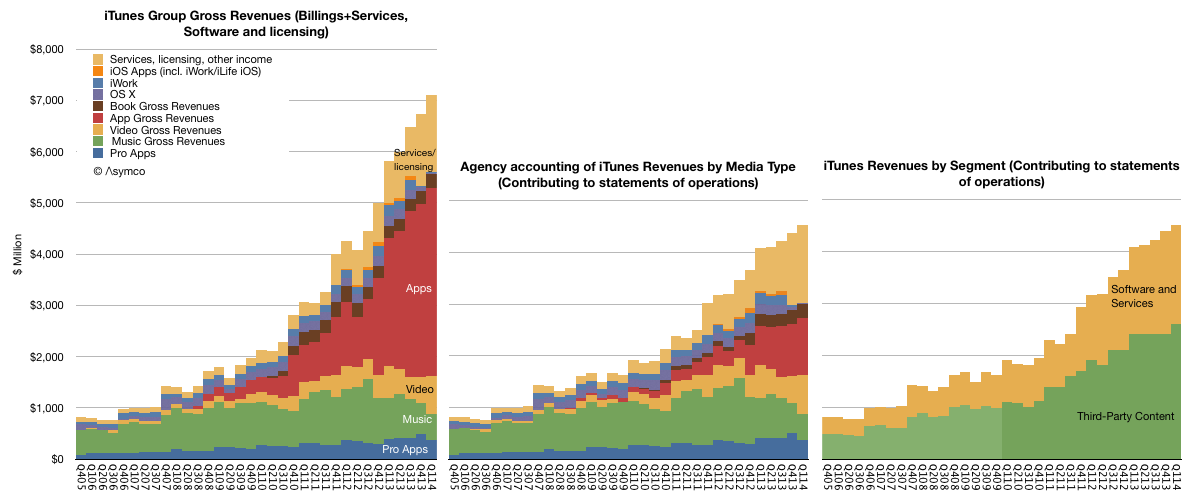
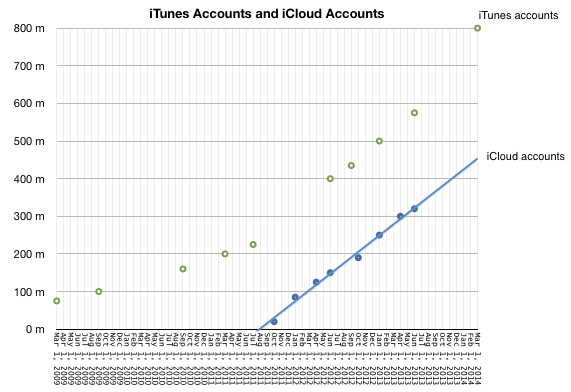
In violation of this convention, there are some companies which manage to obtain revenues from their users. Two such are Apple and Amazon. In the last quarter Apple reported having 800 million iTunes accounts. These aren’t MAUs since the activity level is not noted, but we do know how much is spent on iTunes and services. In addition, Amazon cites 244 million active customer accounts representing accounts which generated purchases within the last 12 months.
This allows us to compare Apple and Amazon in terms of accounts, revenue per account, and, via some analysis, even profitability per account.
The following graphs tell this story. First, the total number of accounts:
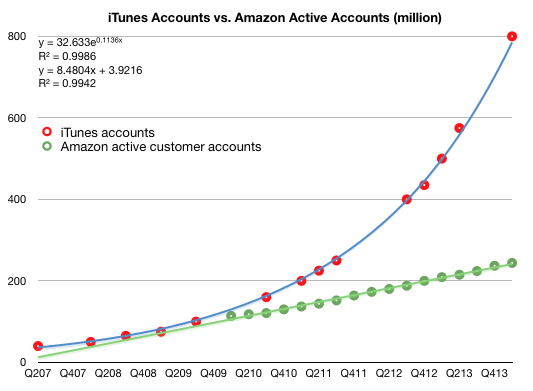
Note that I added trend lines to both graphs and their formulas.
The following are the revenue per account for iTunes (further broken into estimated iTunes segment revenues per account.) and for Amazon. Note that the vertical scales are different. Continue reading “Monthly Apple Users”