When Apple reached parity with Windows

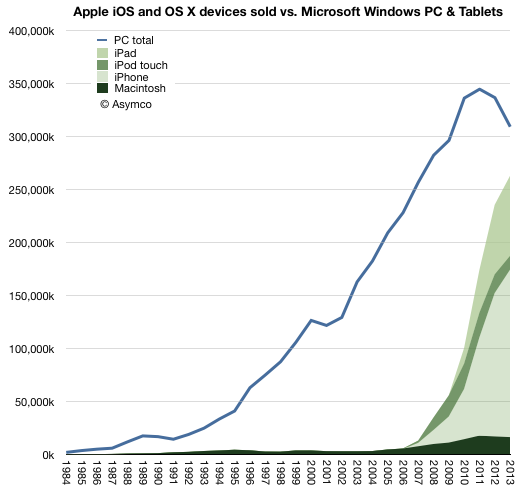
In 2013 there were 18.8 times more Windows PCs sold than Macs. This is a reduction in the Windows advantage from about 19.8x in 2012. This decline is mostly due to the more rapid decline in Windows PC shipments relative to the more modest decline in Mac unit shipments. Gartner estimates that about 309 million Windows PCs were shipped,1 down from 337 million in 2012 (which was down from 344 million in 2011, the year PCs peaked.) I estimate about 16.4 million Macs were shipped in 2013 down from 17 million in 2012.

The history of PC shipments relative to Mac shipments is shown in the following graph:

Screen Shot 2014-01-13 at 1-13-3.09.21 PM

I chose to graph the Mac data as an area with additional areas for iOS devices layered on top.

Continue reading “When Apple reached parity with Windows”

  1. This figure is not published publicly but can be derived from subtracting Mac shipments from the total PC shipments which are published []

When will smartphones saturate?

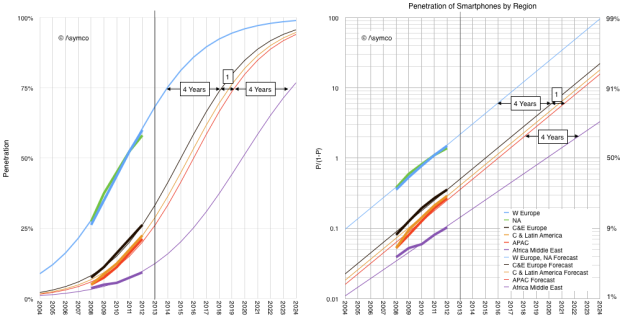
GSMA Intelligence reports provide valuable statistics on the growth of mobile networks. One in particular shows the history of regional smartphone penetration.

I took the historic data and plotted it as follows:

Screen Shot 2014-01-07 at 1-7-1.43.56 PM

Note that I chose to model using the same logistic function that I have used to describe the US market (as measured by comScore) and the global Internet user market (as measured by the ITU) and the stove, landline phone, Electricity, automobile, consumer radios, washing machines, refrigerators, TVs, dryers, air conditioning, dishwashers, microwaves, VCRs, PCs, cellphones.

It’s also the same model used to show the rise and fall of energy sources, canals, railroads, roads and air travel.

If we believe that smartphones in parts other than US and Europe will behave the same way as all the other technologies listed above then the forecast penetration is likely to follow the thin lines in the graphs above.1

With the exception of Africa and Middle East, note that the primary difference between regions is not the rate of growth in penetration but rather the delay in adoption. I marked this delay as 4 years between US/EU and Central & Eastern Europe. An additional one year delay to Asia Pacific region and 4 years more to Africa/Middle East adoption.

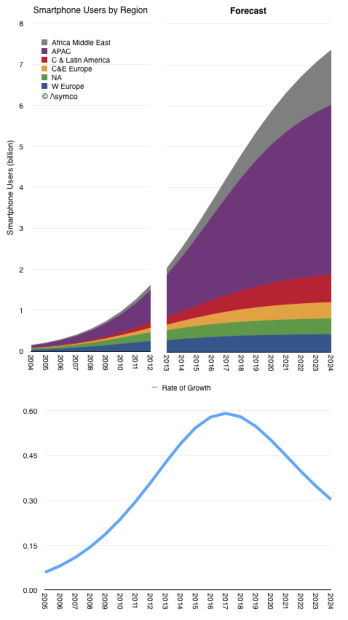
The resulting smartphone user forecast is shown below.

Screen Shot 2014-01-07 at 1-7-1.36.39 PM

Although 2013 was often cited as the year when smartphones saturated (“everybody that wants one has one”), the total population of users will likely take another decade to reach maximum. The point of inflection in global growth could be expected in 2017.

What most observers sensed was the point of inflection in growth in North America and Western Europe. Those regions are 11% of the world’s population.

  1. This is a big if, and, judging by their forecast, one which the GSMA Intelligence team seems not to believe will happen. []

On the future of the Internet and everything

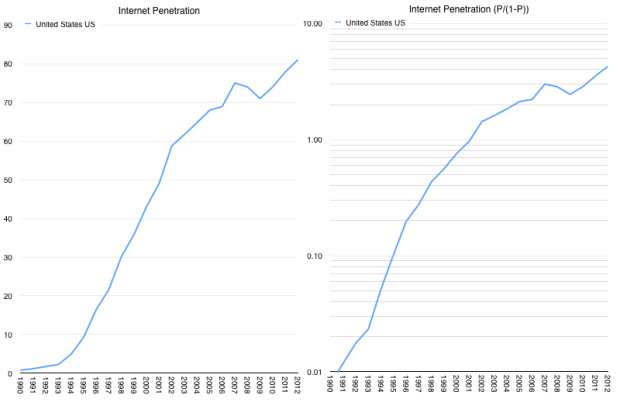
According to ITU data, Internet usage reached about 2.2% penetration in the US (2.2 users per 100 residents) in 1993. The figure in 2012 was 81%. The history of penetration is shown in the following graphs.

Screen Shot 2014-01-03 at 1-3-12.17.41 PM

Similar graphs can be drawn for other countries (data is available for 193 countries/territories.) I chose the following set of countries arbitrarily: Continue reading “On the future of the Internet and everything”

ניהול אחר אפל: צבא התפוחים הסודי: An article on Apple in Calcalist

ניהול אחר אפל: צבא התפוחים הסודי.

An article by Dor Zach, correspondent at Calcalist, the largest economic newspaper in Israel.

I offered some thoughts on Apple’s current strategy, and the various misconceptions about the company.

(Hebrew only so if anyone wishes to summarize it in comments, it would be helpful to others).

The China Mobile iPhone MOQ

“BEIJING and CUPERTINO, California—December 22, 2013—Apple® and China Mobile today announced they have entered into a multi-year agreement to bring iPhone® to the world’s largest mobile network. As part of the agreement, iPhone 5s and iPhone 5c will be available from China Mobile’s expansive network of retail stores as well as Apple retail stores across mainland China beginning on Friday, January 17, 2014.

China Mobile & Apple Bring iPhone to China Mobile’s 4G & 3G Networks on January 17, 2014 – Yahoo Finance

January 17 seems to be an auspicious date.1

Precisely a year prior to that date, on January 17, 2013, I wrote The iPhone MOQ.

Within that post I showed the activation rates for US operators as a percent of total users. Figures ranged from 10% to 19% by year or operators. I further assumed the figures would be toward the high end of that in Japan based on statements by the president of NTT DoCoMo.

The last phrase I used was:

“The MOQ figure as percent of subs for China Mobile would also be an interesting point of debate.”

My assumption would be that CM would start at a base significantly lower than the US or Japan. I would not be surprised to see an MOQ of 4% of user base for 2014. In the press release above China Mobile states that they serve 760 million customers. That implies a minimum order of about 30 million iPhones.

In the absence of any other data it’s best to be conservative.

  1. January 17 is a lucky day in Chinese numerology: 1+7=8 is a multiple of number 8, which is the most auspicious number.  Joe Zou @zzbar via Twitter []

How many Americans will be using an iPhone when the US smartphone market saturates?

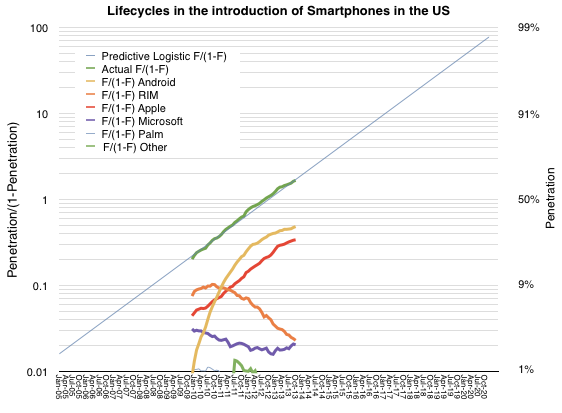
As previously noted, the US smartphone market has followed an almost perfectly logistic growth. The measured data (via comScore, in green below) follows a predictive logistic function (thin blue whose formula is discussed here).

Screen Shot 2013-12-13 at 12-13-11.30.54 AM

The other notable market observation is how closely the iPhone follows the same pattern as the market. The red line representing the iPhone above is almost perfectly parallel to the green and blue lines which represent the overall market. The reason for this seems to be that consumers are absorbing the product in similar way to how they are absorbing the technology.1 The “learning model” which underpins logistic models could offer clues as to the cause. It suggests that there is a direct communication that happens between the product and the consumer.

Continue reading “How many Americans will be using an iPhone when the US smartphone market saturates?”

  1. Note that this pattern of adoption has happened even though the product has been at least partially unavailable to the entire market until quite recently. []

Updated US Smartphone Saturation Forecast

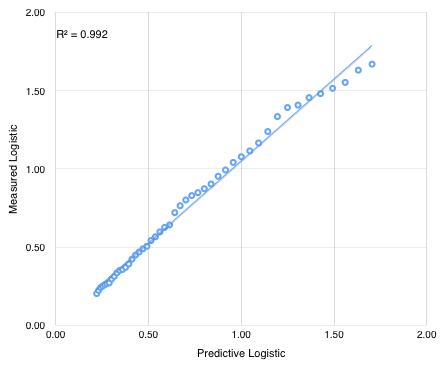
The latest comScore US smartphone survey showing three months’ ending October data has been released and there were no surprises. Smartphone penetration grew to 62.5% representing 149.2 million users. I made a slight adjustment to the predictive logistic function parameters (p1 = 93, p2 = 22.5).

Logistic

The correlation between predictive and actual logistic function (P/(1-P)) is shown below.

Screen Shot 2013-12-10 at 12-10-10.31.29 AM

Continue reading “Updated US Smartphone Saturation Forecast”

When will there be one billion iOS devices in use?

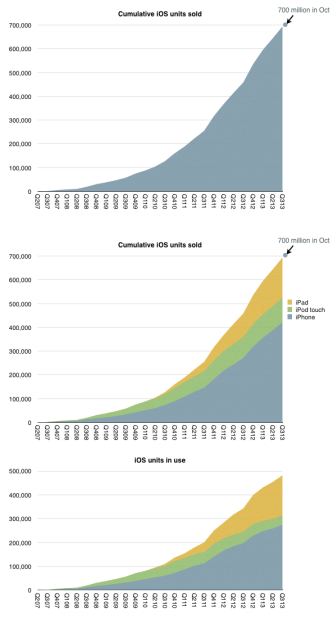
iOS unit sales crossed over 700 million units last month. That is a significant milestone but the total number of units in use is likely to be lower. My estimate based on device replacement assumptions is that about 500 million are still in use.

The estimated break-down of units sold and in use by device type is shown below:

Screen Shot 2013-11-25 at 11-25-2.59.59 PM

Continue reading “When will there be one billion iOS devices in use?”

Seeing What’s Next

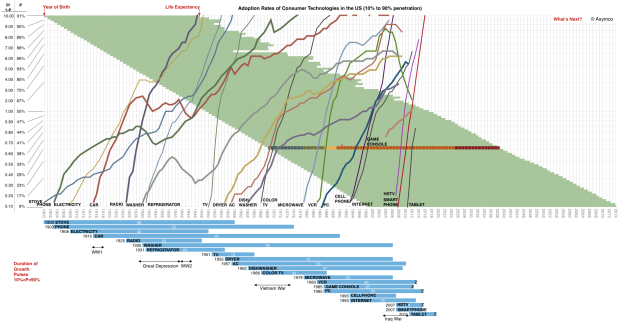
The adoption of smartphones in the US is on track for reaching 90% of the available audience by August 2016. This is a mere eight years after smartphones reached 10% penetration. As far as technologies go, that’s pretty fast. To get an idea of how rapid, I plotted a few other technologies and the time they took to grow within the US market.

Adoption Rates of Consumer Technologies

A few things to note: Continue reading “Seeing What’s Next”

A yardstick for capex

us-navy-ford-carrier.si

Photo credit: Wikipedia, CVN-78

I’ve been writing about Apple’s capital intensive operations for some time. The difficulty has always been in explaining the scale involved. I’ve compared the spending to that of Samsung, Microsoft, Google, Intel and Amazon. But these numbers still can’t be easily grasped. You can’t point to any comparable objects when you try to explain the figure. I struggle to create a less abstract notion than that of a “sea of tooling and servers.”

Instead, I’ve used the analogy of US aircraft carriers. Historically, Nimitz class aircraft carriers have cost a less than $5 billion. The USS Ronald Reagan, christened in 2001, cost $4.5 billion. Therefore I was comfortable saying that Apple spends the equivalent of about one Nimitz class aircraft carrier every six months (and that the Navy takes about six years to put it together.)

Unfortunately, costs for aircraft carriers have gone up. The USS Gerald Ford will take about $13 billion to complete. That places Apple and Samsung capital spending in the following context: Continue reading “A yardstick for capex”