What’s an Active User worth?

Apple has sold 700 million iOS devices. Google claims one billion Android device activations. Microsoft has about 1.5 billion Windows users and Facebook about 1.19 billion. LinkedIn has 259 million users and Twitter has 232 million. Amazon has 215 active account holders and PayPal 137 million.

Markets place a value on these users implicitly when company shares are priced. For example, Twitter whose users are worth about $110 or FaceBook’s $98 and LinkedIn at $93.

This consistency suggests a universally accepted value per social media user but what is the value of an ecosystem user? Apple, Google, Microsoft and even Amazon aspire to enable ecosystems which should be seen are more valuable than mere communities. Ecosystems enable a higher level of economic activity because they are unbounded by the medium itself. Any number of media can be created. Or so the theory goes.

If we could determine a value for an ecosystem user we could test it against the going value of a social media user. Fortunately we have enough data to do so.

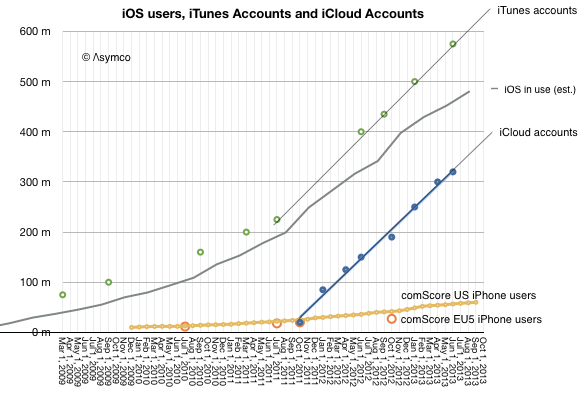
The total number of iOS devices sold per quarter allows us to measure the install base of device users. With some assumptions regarding the retirement and attrition rate we can get the following history:

Screen Shot 2013-11-11 at 11-11-11.52.34 AM

Since the total number of iTunes accounts is updated with some regularity I’ve added it to the graph. I’ve also shown on the same graph the total number of iCloud accounts. For calibration, I included survey data showing the number of iPhone users in two regions (US and EU5). Continue reading “What’s an Active User worth?”

The diffusion of iPhones as a learning process

All theoretical and empirical diffusion studies agree that an innovation diffuses along a S-shaped trajectory. Indeed, the S-shaped pattern of diffusion appears to be a basic anthropologic phenomenon.

This observation dates as far back as 1895 when the French sociologist Gabriel Tarde first described the process of social change by an imitative “group-think” mechanism and a S-shaped pattern.1 In 1983 Everett Rogers, developed a more complete four stage model of the innovation decision process consisting of: (1) knowledge, (2) persuasion, (3) decision and implementation, and (4) confirmation.

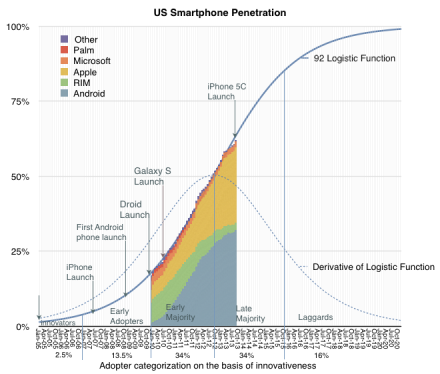
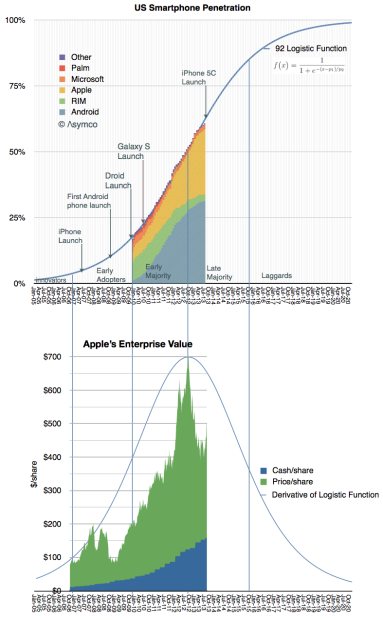
Consequently, Rogers divided the population of potential adopters according to their adoption date and categorized them in terms of their standard deviation from the mean adoption date. He presented extensive empirical evidence to suggest a symmetric bell shaped curve for the distribution of adopters over time. This curve matches in shape the first derivative of the logistic growth and substitution curve as shown below. Screen Shot 2013-11-06 at 11-6-1.51.57 PM

In the graph above I applied the Rogers adopter characterization to the data we have on the adoption of smartphones in the US. The latest data covering September is included.

Continue reading “The diffusion of iPhones as a learning process”

  1. Tarde was probably influenced by mathematician Pierre François Verhulst who first published the logistic function in 1845 []

Do ads work? The ad budgets of various companies

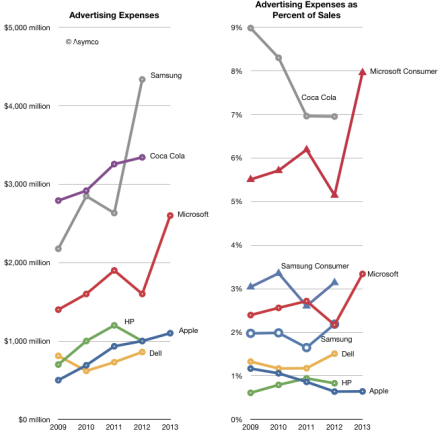
Microsoft spent $2.6 billion for Advertising in the fiscal year ended June. Apple spent $1.1 billion in its fiscal year ended October.

Other companies will report their full year ad spending later but their previous years’ spending is shown below.

Screen Shot 2013-11-04 at 11-4-4.55.03 PM

I added a second graph showing the percent of sales that each ad budget represents. Note that Coca Cola retains the crown as the most prolific advertiser when it comes to budgeting.1

Continue reading “Do ads work? The ad budgets of various companies”

  1. Think of it as 7 percent of every Coke purchase going to pay for the ad that presumably got you to buy it. []

The Quantum Leap in Retail

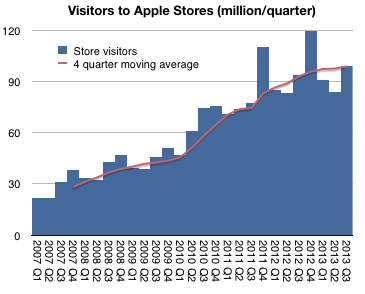
In fiscal 2013 there were 395 million visits to Apple retail stores. In 2012 there were 372 million.

Screen Shot 2013-10-31 at 10-31-2.15.13 PM

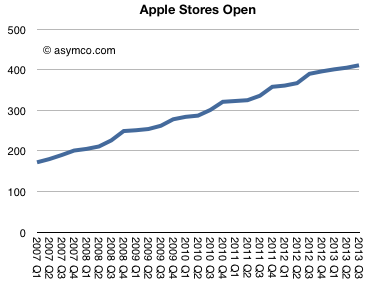
The difference is approximately the population of Australia. This was in addition to the population of the US and Canada already passing through. Although this is a fun way to think about total traffic, it does not reflect performance of the stores themselves since new stores are always being opened. 21 new stores in 2013, to be precise.

Screen Shot 2013-10-31 at 10-31-2.15.21 PM

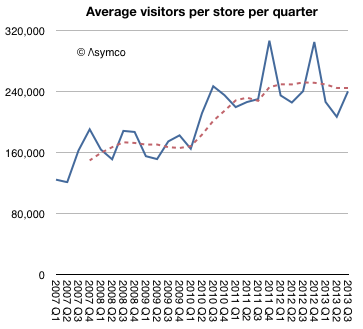
The better benchmark should be the number of visitors per store.

Screen Shot 2013-10-31 at 10-31-2.17.15 PM

This shows that, except for seasonal peaks, the visitors per store per quarter has been a fairly steady 240k since mid-2010. What’s more, this rate was also remarkably steady at around 160k/store/quarter from 2007 to 2010.

So what caused this quantum jump1 in traffic? Continue reading “The Quantum Leap in Retail”

  1. “Quantum leap” is often used to mean “giant leap” but in the original usage it meant a specific, discrete jump []

The value of zero-priced software

Apple’s latest product launch (new OSX, iPads, Macs and iWork/iLife) came with a change in pricing for software. OS X and iWork and iLife and updates are now made available free on new Macs and, in the case of the suites, on iOS devices as well.

Recall also that iOS updates are now free as well and that OS X had been reduced in price from about $129 to $29 with Snow Leopard in August 2009 and to $19 with Mountain Lion in July 2012. The iSuites have also dropped in price over time so the pattern of evaporating software prices is long-running.

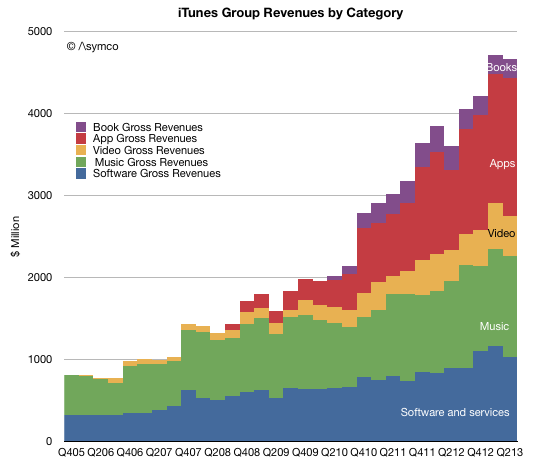
But how fast and what is the impact? The historic performance Apple’s Software business is not easily determined since it was always blended with additional businesses. Until September of last year, Software was reported as part of “Software and Services” and since then as part of “iTunes, Software and Services.” Some assumptions allow the following picture to be drawn:

Screen Shot 2013-10-24 at 10-24-5.07.03 PM

One additional wrinkle to the Apple software story is that OS X and iWork/iLife are not all the software titles available. Apple’s software includes Pro apps as well as the non-free OS X server. The non-free software US prices are: Continue reading “The value of zero-priced software”

How many mobile platforms can a market sustain?

Using logistic curves to measure diffusion of innovations is a powerful method of analysis. However there are limits to what can be learned. The methodology helps in understanding how quickly a pervasive technology is adopted. It assumes that the technology “fills all available space” within a market. It therefore also assumes that whatever problems the technology solves are universal problems.

Put another way, if a technology is not universally useful, it tends to peak before a market saturates. This “universality” condition is in evidence when observing that pervasive technologies are adopted not only by all members of one national market but also all nations and through all means of government and regulation. In other words that the jobs that the technologies are hired to do are so important that they bulldoze any and all obstacles placed in the path of adoption.

The only difference is one of timing. Some regions are quicker than others. Institutionalized obstacles essentially defer rather than deter adoption. They impede rather than block.

And I am pretty sure that smartphones solve universal needs and their adoption will be nearly 100%. They also have fairly low impedance given the speed of adoption (50% penetration in most large markets seems to come in less than 5 years.)

That’s the story for the technology, but how value is captured is another story.

Who captures and how it’s captured are questions of commerce not economics. They are informed by competitive advantage and business models. The puzzle seems to be that individual companies don’t capture value in the patterns of Logistic curves. Or at least I don’t think they do.

Consider the graph below.

Screen Shot 2013-10-22 at 10-22-1.25.54 PM

Continue reading “How many mobile platforms can a market sustain?”

The iPhone company

The analyses of adoption of smartphones in the US and EU5 are remarkably consistent with each other. They also turn out to be consistent with the valuation of Apple.

Screen Shot 2013-10-17 at 10-17-4.01.35 PM

I show the stages of adoption overlaid with the derivative of the Logistic Function and Apple’s enterprise value. The derivative of the Logistic Function shows the speed of adoption, peaking at the inflection point when adoption ceases to accelerate and begins to decelerate. Continue reading “The iPhone company”

When will the European Union Five reach smartphone saturation?

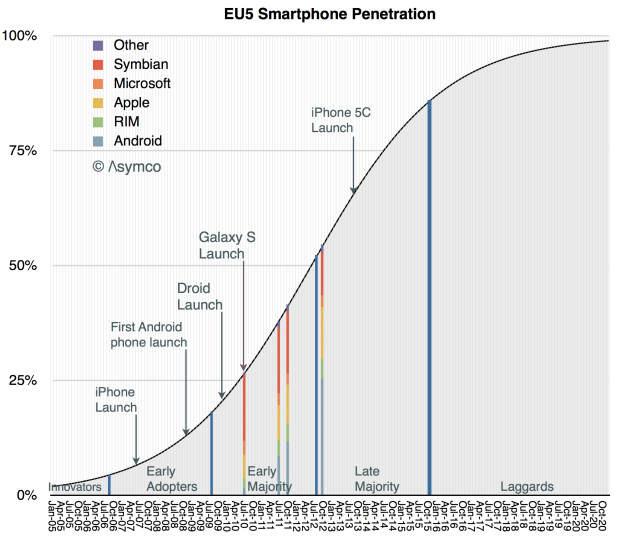
Thanks to Symbian, the EU5 countries (France, Germany, Italy, Spain and the UK) had an earlier start in the conversion of phone usage from non-smart to smart devices. According to published comScore data, in July 2010 the EU5 were at 26.6% penetration of smartphones and the US was at 22.8%1.

However, with the aid of mobile operator subsidies, by the beginning of this year, the US caught up. According to comScore EU5 reached 57% penetration in March 2013 while the equivalent figure for the US was 58%.

Using the logistic curve model introduced last week, it’s possible to get an approximate categorization of the adopters of the technology:

Screen Shot 2013-10-16 at 10-16-2.02.44 PM

As with the previous analysis, the graph identifies the following dates: Continue reading “When will the European Union Five reach smartphone saturation?”

  1. The population is defined as adults using phones for themselves. Meaning it excludes children and phones purchased by companies. []

The Five Year Plan

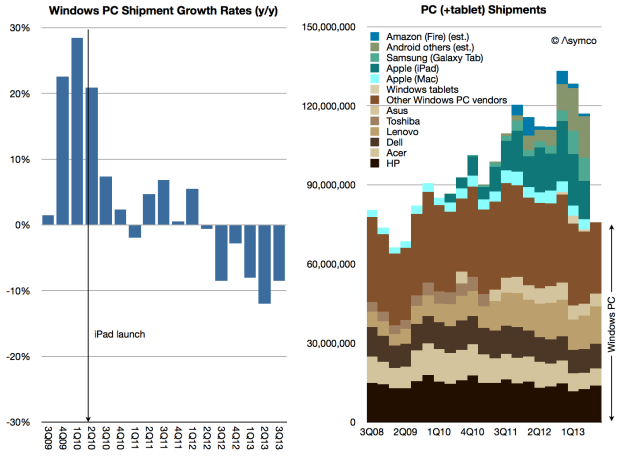
Gartner reported that PC shipments totaled 80.3 million units in Q3. Subtracting an estimated 4.4 million Macs yields an estimated 75.9 million Windows PCs.1

This total is lower than the total shipped in the same period of 2008.


Screen Shot 2013-10-10 at 10-10-11.12.11 AM


The graphs above show the Continue reading “The Five Year Plan”

  1. The total will be less than this as some PCs will not ship with Windows []

Estimating HTC's post-traumatic life expectancy

In May 2012 I wrote:

The pattern may be that companies either have short post-trauma lives of about two to three years or relatively long post-trauma lives lasting 4 to 5 years. What determines this life expectancy and how long do RIM, Nokia and LG have?

via Post-traumatic life expectancy of phone vendors | asymco.

These comments came right after BlackBerry (then RIM) announced a loss and thus entered what I called the “post-traumatic” phase of its existence.1 The observation I have been making is that once a company begins to generate negative operating margins from phone sales, that phone business never recovers.

The question then becomes one of gauging how long they have before the business is sold, dissolved or merged. Since that update, both Nokia and RIM have tentatively agreed to be sold. If the sales go through then we can update the graphs as follows:

Screen Shot 2013-10-04 at 10-4-11.01.11 AM

[Graph note: solid bars in the second graph indicate companies which exited and thus the duration of life post-trauma. Continue reading “Estimating HTC's post-traumatic life expectancy”

  1. The analysis began earlier, in June 2011 []